Skip to main content
Consumer Goods & FMCG
E-Commerce
Economy & Politics
Energy & Environment
Health, Pharma & Medtech
Internet
Media
Technology & Telecommunications
Transportation & Logistics
Travel, Tourism & Hospitality
View all industries
Global data volume growth
Global AI market size
Number of generative AI users worldwide
Global inflation rate
Retail e-commerce sales worldwide
Largest economies worldwide
Biggest social media platforms by users
Global EV market share by manufacturer
International tourist arrivals by world region
Global annual CO₂ emissions
Browse recent statistics
Artificial intelligence (AI) worldwide
TikTok
Nvidia
E-commerce worldwide
Global GDP
Instagram
Apparel market worldwide
Video gaming worldwide
Global renewable energy industry
Influencer marketing worldwide
Browse recent topics
Consumer Trends 2026
Artificial Intelligence: in-depth market analysis
E-commerce challenges
Global economy
TikTok
Luxury goods: in-depth market analysis
Electric vehicles: A global overview
Video gaming worldwide
Travel and tourism trends 2026
Battery recycling worldwide
Browse recent reports
Explore the tool
Explore Classic mode
Advertising & Media
eCommerce
Consumer
Finance
Global Indicators
Health
Industrial
Mobility
Technology
Explore Market Insights
eCommerce Insights
Research AI
Book a demo
All integrations
Developer docs
Explore Statista Connect
Research
Strategy & Consulting
Marketing
Media & PR
Explore AI assistants
Marketing
Research & Development
Strategy
Sales
Find the fact
Tell the story
Win the pitch
Understand the market
Develop your strategy
Academia
Agencies
Consultancies
Consumer goods
Finance
Tech
Research solutions
Strategy consulting
Communication services
Explore Statista+
Statista R
Statista Healthcare
About Statista
First steps & help center
Webinar & training hub
Success stories
Individuals & Small Teams
Businesses & Enterprises
Academia & Government
English
Deutsch
Daily Data
Global stories vividly visualized
Medical Never Events
May 16, 2022
This chart shows the biggest groups of Never Events that took place under the NHS between April 2021 - February 2022.
More Information
Sport
May 13, 2022
This chart categorizes Europa League/UEFA Cup wins from 71/72 to 20/21 by country of club.
More Information
Covid-19 in the U.S.
May 13, 2022
This chart shows the cumulative number of Covid-19 deaths in the United States.
More Information
Cryptocurrencies
May 13, 2022
This infographic charts the daily price of Bitcoin from 2017 to 2022.
More Information
Friday the 13th
May 13, 2022
This chart shows the highest-grossing Friday the 13th franchise entries.
More Information
Mobility
May 12, 2022
This chart shows estimated electric vehicle unit sales per 100,000 population in EU-27 countries and the United states.
More Information
Energy
May 12, 2022
This chart shows the average annual electricity generation using Russian natural gas and forecast renewable generation growth in European...
More Information
Religion
May 11, 2022
This chart shows the share of the population that identifies as an atheist or non-religious by region.
More Information
Mobility
May 11, 2022
This chart shows road accident fatalities per million inhabitants in 2020.
More Information
iPod
May 11, 2022
This chart shows Apple's iPod sales in units and as a percentage of the company's total revenue since 2002.
More Information
Indian Stock Market
May 11, 2022
This chart shows the number of stock market issues in India and money raised through them (in billion U.S. dollars).
More Information
Portable Music
May 11, 2022
This chart shows the launch dates of selected milestone portable music products.
More Information
Cryptocurrencies & NFTs
May 10, 2022
This chart shows the estimated worldwide revenue of cryptocurrency/NFT platforms.
More Information
Economy
May 10, 2022
This chart shows the share of U.S. adults that were very/moderately worried about their finances in 2019 and 2022.
More Information
Fintech
May 9, 2022
This chart shows the global distribution of different fintech segments in 2022 (in percent of transaction value).
More Information
Russian Sanctions
May 9, 2022
This chart shows sanctioned Russian billionaires' superyachts, by value and status as frozen/detained (as of May 9, 2022).
More Information
Smoking
May 9, 2022
This chart shows the share of population (15+) that said they smoke daily in 2019.
More Information
UK
May 9, 2022
This chart shows the number of seats won by Sinn Féin in Northern Ireland Assembly elections compared to the party with the most seats...
More Information
Social media
May 6, 2022
This chart shows the demographics of Truth Social users based on a survey conducted in March, 2022.
More Information
Demographics
May 6, 2022
This chart shows year-on-year change in life expectancy in the EU from 2003 to 2021.
More Information
U.S. Sports
May 6, 2022
This chart shows the active and passive involvement in classic U.S. team sports in the United States.
More Information
Sport
May 5, 2022
This chart shows the share of 21/22 Champions League finalists' squads which have already played in and won a Champions League final.
More Information
Society
May 5, 2022
This chart shows the opinions of adults in selected countries on why Mother's Day is celebrated in 2022.
More Information
Cybersecurity & passwords
May 5, 2022
This chart shows the share of U.S. respondents storing their passwords the following way.
More Information
Palm Oil
May 4, 2022
This chart shows the world's largest palm oil producers.
More Information
Pop culture
May 4, 2022
This chart shows the 12 steps of The Hero's Journey, as deciphered by screenwriter Christopher Vogler.
More Information
Coronavirus pandemic
May 4, 2022
This chart shows the development of the Oxford Containment and Health Index over time.
More Information
Politics
May 4, 2022
This chart shows the issues which GB adults say are/would be very important when voting in May 2022 local elections.
More Information
Trade with Russia
May 4, 2022
This chart shows which countries are most heavily dependent on Russia for trade.
More Information
U.S. border wall
May 3, 2022
This chart shows the number of people that were killed or injured as they tried to cross Trump's wall.
More Information
Covid-19 cases by country
May 3, 2022
This animated chart shows the countries with the highest number of Covid-19 cases from January 2020 through April 2022.
More Information
Abortion
May 3, 2022
This chart shows abortion rates in the U.S. since 1984.
More Information
Sport
May 3, 2022
This chart compares the top ten teams in the Premier League after 11 games in 2020/21 and 2021/22.
More Information
Cruise Ship Pollution
May 2, 2022
This chart shows which ships are the worst soot polluters.
More Information
Technology
May 2, 2022
This chart shows the share of U.S. parents of children under 11 saying their child spends too much time overall playing video games...
More Information
Energy
May 2, 2022
This chart shows EU and U.S. imports of goods from Russia in 2021, by category (in billion U.S. dollars).
More Information
Stock Market
May 2, 2022
This chart compares the performance of major U.S. stock market indices in April 2022.
More Information
UK
Apr 29, 2022
This chart shows the weight of selected 'fatbergs' discovered in the UK.
More Information
Environment
Apr 29, 2022
This chart shows global tree cover loss from boreal forests from 2001 to 2021.
More Information
Apple
Apr 29, 2022
This animated infographic shows Apple's revenue by segment since 2001.
More Information
Container Shipping
Apr 29, 2022
This chart shows the world's biggest container ports in 2005 and 2021 by shipping volume.
More Information
Container Ports
Apr 28, 2022
This chart shows the container ship backlog off the coast of Shanghai.
More Information
Health
Apr 28, 2022
This chart shows the transmittable diseases/disease types that cause the most years of lost life and lost healthy life, by country.
More Information
Presidential Clemency
Apr 28, 2022
This chart shows the number of executive clemency actions granted by U.S. presidents since 1933.
More Information
Work-Life Balance
Apr 28, 2022
This infographic shows the top 12 countries ranked by least quality of work-life balance in 2020.
More Information
Work-Life Balance
Apr 28, 2022
This chart shows the top ten countries ranked by quality of work-life balance in 2020.
More Information
Gender Pay Gap
Apr 27, 2022
This chart shows how men continue to get the top jobs in U.S. universities.
More Information
Netflix Password Sharing
Apr 27, 2022
This chart shows if and how U.S. Netflix users share their passwords.
More Information
Cryptocurrencies
Apr 27, 2022
This chart shows the estimated cryptocurrency gains by country.
More Information
Diversity
Apr 27, 2022
This chart shows the top 10 employers for diversity in the U.S. in 2022.
More Information
IoT
Apr 26, 2022
This chart shows the estimated numbers of household worldwide with smart devices in 2022 and 2027.
More Information
Social Media
Apr 26, 2022
This chart shows the average time spent connected to social networks during a typical day in 2021 (hh:mm).
More Information
Auction houses & auctions
Apr 26, 2022
This chart shows the highest auction prices for items in corresponding categories in 2021.
More Information
TMO
Apr 25, 2022
This chart shows the estimated worldwide revenue of enterprise software in 2022, by segment.
More Information
Fake luxury goods
Apr 25, 2022
This chart shows the share of U.S. luxury shoppers who agree with the following statements on counterfeit products.
More Information
Counterfeit goods
Apr 25, 2022
This chart shows the total value of goods seized for intellectual property rights violations in the U.S. in 2020, by category.
More Information
Politics
Apr 25, 2022
share of vote received by the National Front/National Rally candidate in French presidential elections
More Information
Migration
Apr 25, 2022
This chart shows the number of Ukrainian citizens with residence permits across the EU, with data from the end of 2020.
More Information
Youth Mental Health Crisis
Apr 22, 2022
This chart shows which concerns parents think are impacting their kids' mental health.
More Information
Mental Health in the U.S.
Apr 22, 2022
This chart shows how families’ mental health had dropped since before the pandemic.
More Information
Populism
Apr 22, 2022
This chart shows the national election success of right-wing populist parties in selected countries in Europe.
More Information
Music
Apr 22, 2022
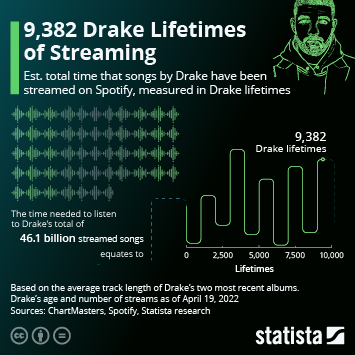
This chart shows the estimated total time that songs by Drake have been streamed on Spotify measured, in Drake lifetimes.
More Information
Football transfers
Apr 22, 2022
This chart shows the world's most expensive football players since 1990.
More Information
Intellectual Property
Apr 22, 2022
This chart shows the global trade volume with counterfeit goods compared to GDP of selected countries/regions.
More Information
Media
Apr 22, 2022
This chart shows the unit sales of printed books in the United States from 2004 to 2021.
More Information
Europe's Gas Shortage
Apr 21, 2022
This chart shows the largest natural gas exporters in Africa, as well as the pipeline routes to Europe.
More Information
Global book market
Apr 21, 2022
This chart shows the worldwide estimated revenue with eBooks and physical books.
More Information
Air Pollution
Apr 21, 2022
This chart shows the number of people living in U.S. counties with unhealthy air pollution levels.
More Information
Housing Market
Apr 21, 2022
This chart shows how house prices and rental costs have risen over the past decade.
More Information
Resources
Apr 20, 2022
This chart shows countries according to the risk of groundwater shortages in 2019.
More Information
Unicorns in India
Apr 20, 2022
This chart shows unicorn startups from India (as of April 2022).
More Information
Unicorns
Apr 20, 2022
This chart shows the number of privately-held, up-and-coming companies with a valuation of $1 billion or more, per country (as of March...
More Information
Employment Trends
Apr 20, 2022
This chart shows productivity levels throughout the day, based on different generations.
More Information
Employment Trends
Apr 20, 2022
This chart shows how employees want greater flexibility in their work schedules.
More Information
Politics
Apr 19, 2022
This chart shows the change in approval rating of U.S. President Biden from 2021 to 2022, by generation group.
More Information
Airline Passengers
Apr 19, 2022
This chart shows FAA investigations into potential federal law violations by unruly airline passengers.
More Information
Digital Divide
Apr 14, 2022
This chart shows how the digital divide continues to persist in the U.S., despite companies and schools having moved online for the...
More Information
Mobility
Apr 14, 2022
This chart shows the global average emissions of passenger cars in 2022 (in kg CO2/year), by type.
More Information
Environment
Apr 14, 2022
This chart shows the share of adults that say it is important to them that their country shifts away from fossil fuels in 2021.
More Information
Health
Apr 14, 2022
This chart shows the share of 16-74 year-olds using the internet for seeking health-related information in 2011 and 2021.
More Information
Meta
Apr 13, 2022
This chart shows Facebook/Meta Platforms costs related to the personal security of Mark Zuckerberg and his family.
More Information
Partygate
Apr 13, 2022
This chart shows the share of the UK public that want Boris Johnson to step down from office in light of 'Partygate'.
More Information
Economics
Apr 13, 2022
Year-over-year change in the Consumer Price Index in Turkey
More Information
Social Media
Apr 11, 2022
This chart shows how the number of newly created Twitter accounts almost tripled on the day Russia invaded Ukraine.
More Information
Voter Turnout
Apr 11, 2022
This chart shows the share of the voting age population that voted in the most recent national election.
More Information
Russia-Ukraine Conflict
Apr 11, 2022
This chart shows Ukraine's and Russia's share in global exports of selected crops between 2016 and 2020.
More Information
Society
Apr 8, 2022
This chart shows the projected share of people in Africa living in extreme poverty from 1996 to 2065.
More Information
Politics
Apr 8, 2022
French Presidential Election: Can Macron Hold Off the Le Pen Surge? Voting intention for the first round of the 2022 French presidential...
More Information
U.S. Perceptions of Russia
Apr 8, 2022
This chart shows how U.S. respondents would categorize the U.S. relationship with Russia.
More Information
Home office & remote work
Apr 8, 2022
This chart shows the countries with the highest estimated collaboration software revenues in 2022.
More Information
55
/
161
Contact
Get in touch with us. We are happy to help.
Do you still have questions?
Feel free to contact us anytime using our
contact form
or visit our
FAQ page
.
Your contact to the Infographics Newsroom
Felix Richter
Data Journalist
felix.richter@statista.com
+49 (40) 284 841 557