Skip to main content
Consumer Goods & FMCG
E-Commerce
Economy & Politics
Energy & Environment
Health, Pharma & Medtech
Internet
Media
Technology & Telecommunications
Transportation & Logistics
Travel, Tourism & Hospitality
View all industries
Global data volume growth
Global AI market size
Number of generative AI users worldwide
Global inflation rate
Retail e-commerce sales worldwide
Largest economies worldwide
Biggest social media platforms by users
Global EV market share by manufacturer
International tourist arrivals by world region
Global annual CO₂ emissions
Browse recent statistics
Artificial intelligence (AI) worldwide
TikTok
Nvidia
E-commerce worldwide
Global GDP
Instagram
Apparel market worldwide
Video gaming worldwide
Global renewable energy industry
Influencer marketing worldwide
Browse recent topics
Consumer Trends 2026
Artificial Intelligence: in-depth market analysis
E-commerce challenges
Global economy
TikTok
Luxury goods: in-depth market analysis
Electric vehicles: A global overview
Video gaming worldwide
Travel and tourism trends 2026
Battery recycling worldwide
Browse recent reports
Explore the tool
Explore Classic mode
Advertising & Media
eCommerce
Consumer
Finance
Global Indicators
Health
Industrial
Mobility
Technology
Explore Market Insights
eCommerce Insights
Research AI
Book a demo
All integrations
Developer docs
Explore Statista Connect
Research
Strategy & Consulting
Marketing
Media & PR
Explore AI assistants
Marketing
Research & Development
Strategy
Sales
Find the fact
Tell the story
Win the pitch
Understand the market
Develop your strategy
Academia
Agencies
Consultancies
Consumer goods
Finance
Tech
Research solutions
Strategy consulting
Communication services
Explore Statista+
Statista R
Statista Healthcare
About Statista
First steps & help center
Webinar & training hub
Success stories
Individuals & Small Teams
Businesses & Enterprises
Academia & Government
English
Deutsch
Daily Data
Global stories vividly visualized
Health
Aug 25, 2021
This chart shows the share of UK respondents agreeing with the specific statements on medical cannabis/CBD in 2021.
More Information
OnlyFans
Aug 25, 2021
This chart shows actual and projected gross merchandise value and revenue of online platform OnlyFans.
More Information
Videogames
Aug 25, 2021
This chart shows survey responses on mobile and PC gaming in India (2021).
More Information
Digital Wellbeing
Aug 25, 2021
This chart shows approximate screen time per day in the UK, US and Germany.
More Information
Food
Aug 24, 2021
This chart shows the most popular UK dining brands in 2021.
More Information
Safe Cities Index
Aug 24, 2021
This chart shows the 10 cities scoring highest in the EIU Safe Cities Index 2021.
More Information
Service Sector
Aug 23, 2021
This chart shows the change in revenue in selected service providing industries in the U.S. between Q2 2019 and Q2 2021.
More Information
CCTV
Aug 23, 2021
This chart shows the most surveilled cities in the world.
More Information
Taliban Takeover
Aug 23, 2021
This chart shows the share of U.S. respondents who said the following about who carries responsibility for the Taliban takeover.
More Information
Religion
Aug 23, 2021
This chart shows the world's largest religious groups in 2015 and in 2060 (projection).
More Information
Society
Aug 20, 2021
This chart shows GB adult responses to the question: ""Do you think the UK has a moral obligation to offer asylum to Afghan refugees...
More Information
Life
Aug 20, 2021
This chart shows UK and US responses to the question ""Which of the following animals, if any, do you think you could beat in a fight...
More Information
COVID-19
Aug 20, 2021
This chart shows COVID-19 cases, hospitalizations and deaths among fully vaccinated/not fully vaccinated people in Wisconsin in July...
More Information
Economic Impact of COVID-19
Aug 20, 2021
This chart shows weekly initial jobless claims in the United States since January 2020.
More Information
Submarine Communications Cables
Aug 19, 2021
This chart shows the longest submarine communications cables currently in use.
More Information
Society
Aug 19, 2021
This chart shows the highest shares of people in European countries that think the level of health risk from Covid-19 tends to be overstated...
More Information
Covid-19
Aug 19, 2021
This chart shows the estimated share of the UK population with SARS-CoV-2 antibodies in July 2021, by country.
More Information
Photography
Aug 19, 2021
This chart shows how often, if at all, professional photographers use smartphone camers to take pictures.
More Information
COVID-19 Vaccines
Aug 19, 2021
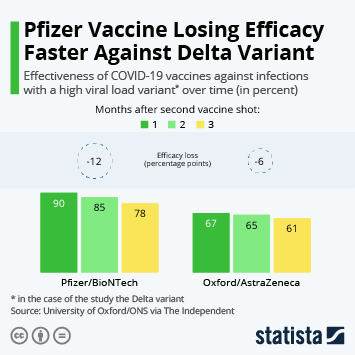
This chart show the effectiveness of COVID-19 vaccines against infections with a high viral load variant over time (in percent).
More Information
Overseas Military Bases
Aug 18, 2021
This chart shows Countries where permanent U.N. Security Council members have foreign military bases (2021).
More Information
Indian Rail
Aug 18, 2021
This chart shows the projected number of AC train sets required in India to fill demand on routes between 200 and 700 kilometers.
More Information
Retail Footfall
Aug 18, 2021
This chart shows the percentage change in number of visits to businesses in the U.S. in July/August 2021 compared to the same period...
More Information
Afghanistan
Aug 18, 2021
This chart shows selected countries by number of Afghan refugees they are hosting (2020).
More Information
Agriculture
Aug 17, 2021
This chart shows the share of total EU harvested potato production in 2020, by country.
More Information
Technology adoption
Aug 17, 2021
This chart shows the differences in technology adoption in the United States by household income.
More Information
Internet availability worldwide
Aug 17, 2021
The chart shows the percentage of households with internet access by area and region.
More Information
Consumer Technology
Aug 17, 2021
This chart shows estimated consumer technology sales in the United States in 2021 in selected categories.
More Information
Afghanistan
Aug 17, 2021
Afghanistan on selected terrorism/violence indices.
More Information
Venture Capital
Aug 16, 2021
This chart shows shares of corporate venture capital deals by continent.
More Information
Global Warming
Aug 16, 2021
This chart shows global land and ocean surface temperature anomalies in July (compared to the 20th century average).
More Information
COVID-19 Impact on Tourism
Aug 16, 2021
This chart shows the change in international tourist arrivals from January through May 2021 compared to the same period of 2019.
More Information
Energy
Aug 13, 2021
This chart shows the share of EU hard coal production from 1990 to 2020, by member state.
More Information
Football
Aug 13, 2021
This chart shows the Premier League clubs which the most fans say they love or hate in 2021.
More Information
Demographics
Aug 13, 2021
This chart shows the population by racial/ethnic group in the United States (in million) and share of total population in 2010 and...
More Information
War in Afghanistan
Aug 13, 2021
This chart shows the status of Afghan provinces by threat of coming under Taliban control (as of Aug 13, 2021).
More Information
Sport
Aug 13, 2021
This chart shows the football players with the highest cumulative transfer fees.
More Information
Food delivery services in the UK
Aug 13, 2021
The chart shows the most popular food delivery services in the UK.
More Information
Smartphone Market
Aug 13, 2021
This chart breaks down global smartphone shipments by operating system.
More Information
Economy
Aug 12, 2021
This chart looks at monthly changes in GDP in June 2021 of UK services industries.
More Information
Airlines
Aug 12, 2021
This chart shows revenue of the largest U.S. passenger airlines in Q2 2021.
More Information
Mask Mandates
Aug 12, 2021
This chart shows school mask mandates by U.S. state (as of Aug 10, 2021).
More Information
Society
Aug 11, 2021
More Information
Sport
Aug 11, 2021
This chart shows the total medals won by Team GB at the Olympic games from 1992 to 2021.
More Information
Manufacturing industry in the UK
Aug 11, 2021
The chart shows UK manufacturers' sales by product category.
More Information
IPOs in South Korea
Aug 11, 2021
This chart shows money raised in major IPOs of South Korean companies in 2021 (past & upcoming).
More Information
International Politics
Aug 11, 2021
This chart shows the heads of government/heads of state of selected countries between 2005 and 2021.
More Information
Governors in the U.S.
Aug 11, 2021
This chart shows the historic number of female governors by U.S. state.
More Information
U.S. Labor Market
Aug 11, 2021
This chart shows the number of job openings, quits and layoffs in the United States (seasonally adjusted).
More Information
Climate Change
Aug 11, 2021
This chart shows climate change patterns observed with scientific consensus across different world regions (1950-2021).
More Information
Wildfires in Europe
Aug 10, 2021
This chart shows the total area burned by fires larger than 30 ha in European countries most at risk of wildfires (as of Aug. 10, 2021).
More Information
COVID-19 in the U.S.
Aug 10, 2021
This chart shows the number of unvaccinated people and COVID-19 hospitalizations in the best & worst vaccinated U.S. states (as of...
More Information
Covid-19 Vaccine Rollout
Aug 10, 2021
This chart shows the share of residents in U.S. states who are fully vaccinated against Covid-19.
More Information
Labor Market
Aug 9, 2021
This chart shows the share of self-employed workers in selected countries in 2019.
More Information
Tokyo Olympics
Aug 9, 2021
This chart shows the medals won in the Tokyo Summer Olympics by the top 10 most successful countries (by gold medals).
More Information
Tokyo Olympics
Aug 9, 2021
This chart shows the countries with the highest number of inhabitants per medal won in the Tokyo Olympics 2020/21.
More Information
COVID-19 Outbreak
Aug 6, 2021
This chart shows the number of fully vaccinated Americans who became infected with COVID-19 and were hospitalized or died.
More Information
Football
Aug 6, 2021
This chart shows the number of goals scored by Lionel Messi for FC Barcelona.
More Information
Internet
Aug 6, 2021
This chart shows the number of websites online from 1991 to 2021.
More Information
UK beer preferences
Aug 6, 2021
The chart shows the most popular beer categories in the UK.
More Information
Tourism
Aug 5, 2021
This chart shows how countries are rated by the UK for travel during the Covid-19 pandemic as of 8 Aug 2021.
More Information
Delta Variant
Aug 5, 2021
This chart shows the number of Delta variant infections in the previous four weeks and share of total new COVID-19 infections in selected...
More Information
COVID-19
Aug 5, 2021
This chart shows cumulative global COVID-19 cases as of August 4, 2021.
More Information
Healthcare in high-income countries
Aug 5, 2021
The chart shows the ranking of selected countries according to their healthcare system.
More Information
COVID-19 in Japan
Aug 4, 2021
This chart shows the seven-day average of new confirmed COVID-19 cases in Japan.
More Information
200th anniversary of Louis Vuitton
Aug 4, 2021
This chart shows the 10 most valuable luxury brands worldwide by brand value in 2021 (in billion U.S. dollars)
More Information
Digital video and TV in the UK
Aug 4, 2021
The chart shows the percentage of people watching digital video or TV for a given amount of hours in the UK.
More Information
Human Hair Exports
Aug 4, 2021
This chart shows the value of human hair and related products exported from India 2015-2020 (in million U.S. dollars).
More Information
Worries
Aug 4, 2021
This chart shows nation's biggest concerns by number of respondents naming them in selected countries (in percent).
More Information
Economic Impact of COVID-19
Aug 3, 2021
This chart shows the Manufacturing Purchasing Managers Index (PMI) of China.
More Information
COVID-19 Pandemic
Aug 3, 2021
This chart shows the seven-day rolling average of newly confirmed COVID-19 cases per million people in the U.S. and the European Union.
More Information
Professional sports and neurodegenerative disease
Aug 3, 2021
The chart show the percentage of former football players with neurodegenerative diseases by position.
More Information
Surviving the Apocalypse
Aug 2, 2021
This chart shows the most favorable starting locations/countries in the event of global societal collapse (2021).
More Information
Evictions in the U.S.
Aug 2, 2021
The chart shows the number of U.S. adults living in rental housing that are currently behind on rent.
More Information
Tokyo Olympics
Aug 2, 2021
This chart shows the estimated bonus per gold medal at the Olympic Games in Tokyo.
More Information
COVID-19 Vaccines
Jul 30, 2021
This chart shows the countries which have fully authorized coronavirus vaccines of Chinese origin (as of July 28, 2021).
More Information
Beauty
Jul 30, 2021
This chart shows the time spent on make-up routines in selected countries in 2021 (in percent).
More Information
Digitalization
Jul 30, 2021
This charts shows the estimated amount of data created on the internet in one minute in 2021.
More Information
COVID-19 Vaccines
Jul 30, 2021
This chart shows how many Americans have changed their minds on getting a COVID-19 vaccine between January and June 2021.
More Information
UNESCO World Heritage
Jul 30, 2021
The chart shows the number of UNESCO world heritage sites per region.
More Information
Car manufacturing and corona
Jul 29, 2021
The chart shows the cars produced in the UK since its first lockdown per month.
More Information
Automation
Jul 28, 2021
This chart shows the automation preparedness score in selected countries in the APAC region (2021).
More Information
Digital and analogue music in the UK
Jul 28, 2021
The chart shows the percentage of people listening to music for a given amount of hours in the UK.
More Information
Homelessness
Jul 27, 2021
This chart shows the estimated number of people sleeping rough in England from 2010 to 2020.
More Information
Sponsored Post
Jul 27, 2021
More Information
COVID-19 Travel Restrictions
Jul 27, 2021
This chart shows the countries which have not opened their borders for travelers in the COVID-19 pandemic and regional totals (as of...
More Information
Tokyo 2020
Jul 27, 2021
This chart shows the number of Team USA athletes taking part in the 2020/21 Tokyo Olympics per million of population in their home...
More Information
Electric cars
Jul 27, 2021
This chart shows the estimated reduction in life-cycle greenhouse gas emissions of new medium-size electric cars compared to comparable...
More Information
Digital Currencies
Jul 27, 2021
The chart shows the status of central bank digital currencies in Europe.
More Information
COVID-19 Vaccine Rollout
Jul 26, 2021
This chart shows the seven-day average of COVID-19 vaccine doses administered in the United States.
More Information
Afghanistan
Jul 26, 2021
This chart shows the number of military deaths in foreign interventions in Afghanistan.
More Information
62
/
161
Contact
Get in touch with us. We are happy to help.
Do you still have questions?
Feel free to contact us anytime using our
contact form
or visit our
FAQ page
.
Your contact to the Infographics Newsroom
Felix Richter
Data Journalist
felix.richter@statista.com
+49 (40) 284 841 557