Skip to main content
Consumer Goods & FMCG
E-Commerce
Economy & Politics
Energy & Environment
Health, Pharma & Medtech
Internet
Media
Technology & Telecommunications
Transportation & Logistics
Travel, Tourism & Hospitality
View all industries
Global data volume growth
Global AI market size
Number of generative AI users worldwide
Global inflation rate
Retail e-commerce sales worldwide
Largest economies worldwide
Biggest social media platforms by users
Global EV market share by manufacturer
International tourist arrivals by world region
Global annual CO₂ emissions
Browse recent statistics
Artificial intelligence (AI) worldwide
TikTok
Nvidia
E-commerce worldwide
Global GDP
Instagram
Apparel market worldwide
Video gaming worldwide
Global renewable energy industry
Influencer marketing worldwide
Browse recent topics
Consumer Trends 2026
Artificial Intelligence: in-depth market analysis
E-commerce challenges
Global economy
TikTok
Luxury goods: in-depth market analysis
Electric vehicles: A global overview
Video gaming worldwide
Travel and tourism trends 2026
Battery recycling worldwide
Browse recent reports
Explore the tool
Explore Classic mode
Advertising & Media
eCommerce
Consumer
Finance
Global Indicators
Health
Industrial
Mobility
Technology
Explore Market Insights
eCommerce Insights
Research AI
Book a demo
All integrations
Developer docs
Explore Statista Connect
Research
Strategy & Consulting
Marketing
Media & PR
Explore AI assistants
Marketing
Research & Development
Strategy
Sales
Find the fact
Tell the story
Win the pitch
Understand the market
Develop your strategy
Academia
Agencies
Consultancies
Consumer goods
Finance
Tech
Research solutions
Strategy consulting
Communication services
Explore Statista+
Statista R
Statista Healthcare
About Statista
First steps & help center
Webinar & training hub
Success stories
Individuals & Small Teams
Businesses & Enterprises
Academia & Government
English
Deutsch
Daily Data
Global stories vividly visualized
Covid-19 Pandemic
Jan 5, 2021
This chart shows estimated U.S. healthcare worker deaths in the pandemic by occupation.
More Information
WFH in India
Jan 5, 2021
This chart shows survey responses about working from home among urban Indian millennials (Oct/Nov 2020).
More Information
Covid-19 Pandemic
Jan 5, 2021
This chart shows U.S. healthcare worker deaths from Covid-19 by country of origin up to December 23, 2020.
More Information
Real estate
Jan 5, 2021
This chart shows the median home prices as a multiple of median income, by cities with the largest discrepancy.
More Information
Electric vehicles
Jan 5, 2021
This chart shows the demand increase in precious metals and materials between 2019 and 2030.
More Information
Politics
Jan 5, 2021
This chart shows the number of seats filled in the U.S. House and Senate by religion in 2021.
More Information
Coronavirus
Jan 4, 2021
This chart shows the influence the coronavirus outbreak had on selected Asian stock indices (2020/21).
More Information
Year in Review
Jan 4, 2021
This chart shows annual gains of selected major stock market indices in 2020.
More Information
Covid-19 pandemic
Jan 4, 2021
This chart shows the cumulative number of reported vaccinations against Covid-19 in German federal states.
More Information
Statista Holiday Break
Dec 23, 2020
More Information
K-Pop
Dec 23, 2020
This chart shows physical album sales of K-Pop band BTS as well as singles, downloads and streams of the albums' songs converted into...
More Information
Car Sales
Dec 23, 2020
This chart shows the development of car production, domestic sales and exports in Japan (2019-2020).
More Information
Society
Dec 22, 2020
This chart reveals the Christmas plan/behaviour changes in the U.S. in 2020. the changes people are making to their holiday plans...
More Information
COVID-19 Stimulus
Dec 22, 2020
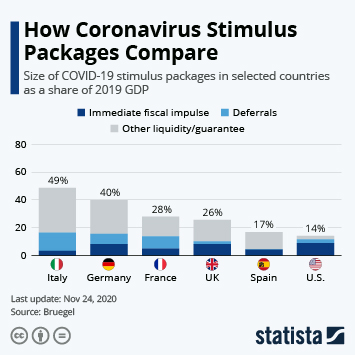
This chart show stimulus packages passed because of the coronavirus pandemic in selected countries (2020).
More Information
Economic Impact of COVID-19
Dec 22, 2020
This chart shows the year-on-year change in monthly car sales in China.
More Information
COVID-19 in India
Dec 22, 2020
This chart shows the distribution of COVID-19 cases and deaths among different cities and states in India (as of December 21, 2020).
More Information
S&P 500
Dec 22, 2020
This chart shows the market cap of the 10 largest companies included in the S&P 500 index.
More Information
Oil profitability
Dec 22, 2020
This chart shows the average oil price and break-even price of West Texas Intermediate oil per barrel (in U.S. dollars).
More Information
Stimulus
Dec 22, 2020
This chart shows the percentage of U.S. adults that would use a $600 stimulus check in the following ways.
More Information
UAPA
Dec 21, 2020
This chart shows the number of active cases under the Unlawful Activities Prevention Act in India between 2014 and 2019.
More Information
New year
Dec 18, 2020
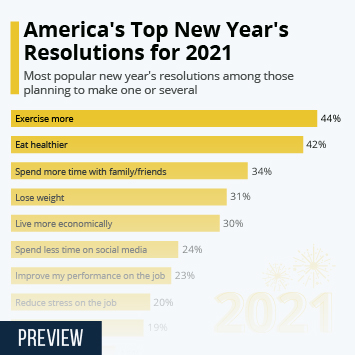
This chart shows the most popular new year's resolutions among U.S. Americans for 2021.
More Information
Media
Dec 18, 2020
This chart shows the earnings of the top earning YouTubers in 2020.
More Information
E-Sports
Dec 18, 2020
This chart shows the share of respondents in selected countries who are familiar with/engaged in e-sports.
More Information
Coronavirus
Dec 18, 2020
This chart shows world leaders who have tested positive for Covid-19.
More Information
Energy
Dec 18, 2020
This chart shows the cumulative lithium-ion battery demand for electric vehicle/energy storage applications (in gigawatt hours).
More Information
Boxing Champions
Dec 17, 2020
This chart shows the boxers who won world titles in the highest number of different weight division (as of Dec 2020).
More Information
COVID-19
Dec 17, 2020
This chart shows the percentage of U.S. adults who would/would not get a COVID-19 vaccine if it was free and deemed safe by scientists.
More Information
Coronavirus
Dec 16, 2020
This chart shows effects on consumer spending in South Korea due to the second and third waves of coronavirus, by sector (2020).
More Information
Pedestrian Scrambles
Dec 16, 2020
This chart shows facts and figures about pedestrian scramble (Barnes Dance) street crossings.
More Information
Beethoven turns 250
Dec 16, 2020
This chart shows how many monthly listeners the most popular classical composers have on Spotify.
More Information
Headphone prices
Dec 16, 2020
This chart compares the price of Apple's new AirPods Max to similar wireless over-ear headphones.
More Information
Society
Dec 16, 2020
This chart reveals the Christmas plan/behaviour changes in the UK in 2020.
More Information
G7
Dec 16, 2020
This chart shows the largest economies by share of global GDP (in purchasing power parity).
More Information
Coronavirus vaccine
Dec 16, 2020
This chart shows the percentage of U.S. groups who are most hesitant toward the COVID-19 vaccine.
More Information
Coronavirus vaccine
Dec 16, 2020
This chart shows the percentage of U.S. adults who would/would not get a COVID-19 vaccine if it was free and deemed safe by scientists.
More Information
Remote work
Dec 16, 2020
This chart shows the percentage of U.S. work teams/departments that plan to work remotely in five years, compared to pre-pandemic.
More Information
AI
Dec 15, 2020
This chart shows productivity increases due to artificial intelligence application expected per country until 2035.
More Information
Restaurant Industry
Dec 14, 2020
This chart shows key figures illustrating the impact of the COVID-19 pandemic on the U.S. restaurant industry.
More Information
UN Mountain Day
Dec 11, 2020
This chart shows the highest urban centers of one million inhabitants or more in the world.
More Information
Review
Dec 11, 2020
A 2020 review in numbers.
More Information
Languages
Dec 11, 2020
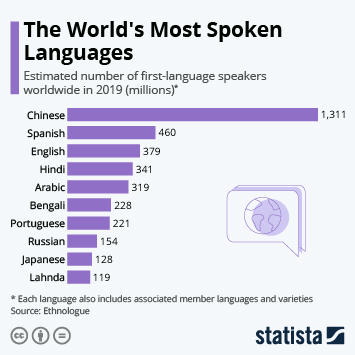
This chart shows the estimated number of first-language speakers worldwide in 2019.
More Information
Death
Dec 11, 2020
This chart shows the total number of people who died from the following conditions.
More Information
Arab League
Dec 11, 2020
This chart shows the Arab countries in the Middle East and North Africa that have normalized ties with Israel.
More Information
Climate change
Dec 11, 2020
This chart shows the carbon offsets purchased by select companies from 2017-2019 (in thousand metric tons of carbon dioxide equivalent).
More Information
Pop music
Dec 11, 2020
This chart shows the percentage of Taylor Swift fans in the U.S. who said each album is their favorite.
More Information
"Person of the Year"
Dec 10, 2020
This chart shows recipients of Time magazine's "Person of the Year" title, by category.
More Information
Pandemic
Dec 10, 2020
This chart shows the year-on-year change in ticket revenue for U.S. performing arts venues in 2020.
More Information
5G
Dec 10, 2020
This chart shows the projected 5G market penetration in selected countries by 2025 (as of December 2020).
More Information
Google Searches
Dec 10, 2020
This chart shows the most common search terms on Google in the U.S. in 2020.
More Information
Health
Dec 10, 2020
This chart looks at the share of Covid-19 vaccines purchased by wealth nations.
More Information
Internet
Dec 10, 2020
This chart shows the search terms which had the largest increases in 2020 compared to 2019.
More Information
Covid-19 Pandemic
Dec 10, 2020
This chart shows ICU occupancy rates at or above 100% in U.S. hospital service areas with high populations*
More Information
FTC vs. Facebook
Dec 10, 2020
This chart shows monthly active users of Instagram and WhatsApp at the time of their acquisition by Facebook and today.
More Information
Plastic Pollution
Dec 10, 2020
This chart shows the number of branded pieces of plastic waste found in global cleanups in 2020.
More Information
Travel
Dec 10, 2020
This chart shows the most popular destinations for U.S. resident travelers in 2019 as well as the countries where traveler volume most...
More Information
Fuel Cell Vehicles
Dec 9, 2020
This chart shows the number of hydrogen fuel cell vehicles on the road in selected countries in 2019 and targets for the future.
More Information
North Korea
Dec 9, 2020
This chart shows the most important sources of information for North Koreans.
More Information
Pandemic
Dec 9, 2020
This chart shows the year-on-year change in ticket revenue for UK performing arts venues in 2020.
More Information
Water Access
Dec 9, 2020
This chart shows the estimated number of households/people without piped running water in U.S. metros in 2020.
More Information
Etsy
Dec 9, 2020
This chart shows Etsy's global gross merchandise sales.
More Information
Polygamy
Dec 9, 2020
This chart shows the share of individuals living in polygamous households in 2019.
More Information
Pollution
Dec 9, 2020
This chart shows the number of countries in which plastic waste was found and pieces of waste recorded in 2020.
More Information
Unemployment
Dec 9, 2020
This chart shows the number of continued work-sharing claims made in the U.S. in 2020.
More Information
Afghanistan
Dec 8, 2020
This chart shows the estimated number of Afghan civilians killed in airstrikes by the U.S. and its allies.
More Information
Airbnb IPO
Dec 8, 2020
This chart shows monthly gross booking value on Airbnb.
More Information
Technosphere
Dec 8, 2020
This graphic shows the estimated weight of human material output on Earth.
More Information
Tesla
Dec 8, 2020
This chart shows the gender and racial composition of Tesla's leadership and wider workforce in 2020.
More Information
Unemployment
Dec 8, 2020
This chart shows the percentage of U.S. adults whose unemployment benefits end during each time frame.
More Information
Coronavirus
Dec 8, 2020
This chart shows the percentage of U.S. adults who describe their mental health in "excellent" condition.
More Information
Employment
Dec 7, 2020
This chart shows the average time spend with one employer in selected OECD countries in 2019.
More Information
Sea Ltd.
Dec 7, 2020
This chart shows key financial figures from Sea Ltd. quarterly reports.
More Information
Iranian Nuclear Program
Dec 7, 2020
This chart shows known assassinations of figures associated with Iran's nuclear program.
More Information
International Trade
Dec 7, 2020
This chart shows the monthly U.S. trade deficit in goods and services (seasonally adjusted).
More Information
Sponsored Post
Dec 7, 2020
More Information
Higher Ed
Dec 4, 2020
This chart shows survey responses to the question "In five years, how do you think higher education will be carried out in your country?"
More Information
COVID-19 deaths by age
Dec 4, 2020
This chart shows the distribution of COVID-19 deaths and the total population in the United States by age group.
More Information
World Soil Day
Dec 4, 2020
This chart shows the global extraction of industrial sand and gravel (silica sand) per year.
More Information
Environment
Dec 4, 2020
This chart shows the total annual territorial UK greenhouse gas emissions from 1990 to 2019.
More Information
Box Office
Dec 4, 2020
This chart shows weekly box office earnings in the North America in 2020.
More Information
U.S. Elections
Dec 3, 2020
This chart shows outside spending an Super PAC spending in U.S. elections since 1990.
More Information
Climate Change
Dec 3, 2020
This chart shows the places with highest share of people believing in man-made climate change (2020).
More Information
Climate Change
Dec 3, 2020
This chart shows the country where most respondents denied (man-made) climate change.
More Information
Wages in the United States
Dec 3, 2020
This chart shows average weekly earnings of all private sector employees in the United States.
More Information
Covid-19
Dec 3, 2020
This chart shows the vaccination timeline for the Pfizer/BioNTech Covid-19 BNT162b2 vaccine.
More Information
Consumer Prices
Dec 2, 2020
This chart shows the monthly growth of consumer prices in South Korea.
More Information
Climate Change
Dec 2, 2020
This chart shows the share of people in selected countries who agree human activity contributes to climate change.
More Information
Slack
Dec 2, 2020
This chart shows paid customers of Slack at the end of the respective period.
More Information
Health
Dec 2, 2020
This chart shows the number of confirmed doses of Covid-19 vaccines secured by the UK.
More Information
Lab-Grown Meat
Dec 2, 2020
This chart shows the share of global lab-grown meat companies by focus on selected meats varieties and location (as of Feb 2020).
More Information
Brazil
Dec 2, 2020
This chart shows estimated deforestation in the Brazilian Amazon (km2).
More Information
70
/
161
Contact
Get in touch with us. We are happy to help.
Do you still have questions?
Feel free to contact us anytime using our
contact form
or visit our
FAQ page
.
Your contact to the Infographics Newsroom
Felix Richter
Data Journalist
felix.richter@statista.com
+49 (40) 284 841 557