Skip to main content
Consumer Goods & FMCG
E-Commerce
Economy & Politics
Energy & Environment
Health, Pharma & Medtech
Internet
Media
Technology & Telecommunications
Transportation & Logistics
Travel, Tourism & Hospitality
View all industries
Global data volume growth
Global AI market size
Number of generative AI users worldwide
Global inflation rate
Retail e-commerce sales worldwide
Largest economies worldwide
Biggest social media platforms by users
Global EV market share by manufacturer
International tourist arrivals by world region
Global annual CO₂ emissions
Browse recent statistics
Artificial intelligence (AI) worldwide
TikTok
Nvidia
E-commerce worldwide
Global GDP
Instagram
Apparel market worldwide
Video gaming worldwide
Global renewable energy industry
Influencer marketing worldwide
Browse recent topics
Consumer Trends 2026
Artificial Intelligence: in-depth market analysis
E-commerce challenges
Global economy
TikTok
Luxury goods: in-depth market analysis
Electric vehicles: A global overview
Video gaming worldwide
Travel and tourism trends 2026
Battery recycling worldwide
Browse recent reports
Explore the tool
Explore Classic mode
Advertising & Media
eCommerce
Consumer
Finance
Global Indicators
Health
Industrial
Mobility
Technology
Explore Market Insights
eCommerce Insights
Research AI
Book a demo
All integrations
Developer docs
Explore Statista Connect
Research
Strategy & Consulting
Marketing
Media & PR
Explore AI assistants
Marketing
Research & Development
Strategy
Sales
Find the fact
Tell the story
Win the pitch
Understand the market
Develop your strategy
Academia
Agencies
Consultancies
Consumer goods
Finance
Tech
Research solutions
Strategy consulting
Communication services
Explore Statista+
Statista R
Statista Healthcare
About Statista
First steps & help center
Webinar & training hub
Success stories
Individuals & Small Teams
Businesses & Enterprises
Academia & Government
English
Deutsch
Daily Data
Global stories vividly visualized
Tech
May 7, 2019
This infographic shows the apps most often downloaded from the Play Store in April 2019.
More Information
Lok Sabha
May 7, 2019
This chart shows demands of first-time voters towards the incoming Indian parliament.
More Information
AI Investment
May 7, 2019
This chart shows the number of artificial intelligence investments by investor, worldwide as of May 2019.
More Information
Sponsored Post
May 7, 2019
Data depicts the global leaders in the investment sector along with a regional breakdown
More Information
Royal Family
May 7, 2019
This chart illustrates the economic effect of royal babies in the UK.
More Information
Quantum Computing
May 6, 2019
This chart shows the quantum computing systems produced by organization(s) in qubits, between 1998 to 2019.
More Information
Environment
May 6, 2019
Key takeaways from the "summary for policymakers" report on human impact on nature.
More Information
Israel and Gaza
May 6, 2019
This chart provides an overview of rocket and military attacks in Israel and Gaza on May 4-5, 2019.
More Information
Nightlife
May 6, 2019
This charts shows the average cost of a night out in European cities in 2019.
More Information
U.S. Military
May 6, 2019
This chart shows the estimated number of sexual assaults and formal reports filed by service members.
More Information
Trade Show Marketing
May 3, 2019
This chart shows the percent that feel trade shows are an effective marketing medium.
More Information
Ad Fraud
May 3, 2019
This chart shows year-over-year dollars lost to digital ad fraud, in billion U.S. dollars.
More Information
Autonomous Car Safety
May 3, 2019
This chart shows the share of U.S. adults that would feel safe as a pedestrian in a city with self-driving cars.
More Information
Internet Usage in the U.S.
May 3, 2019
This chart show the percent of U.S. adults who say they do not use the internet in 2019.
More Information
World Press Freedom
May 3, 2019
This chart shows the global freedom of information law adoption, by century of adoption.
More Information
Web Traffic
May 3, 2019
This chart shows the year-on-year growth of referral traffic from leading social networks to U.S. websites.
More Information
U.S. Job Market
May 3, 2019
This chart shows the seasonally adjusted unemployment rate for people aged 16 and older in the U.S.
More Information
European Union
May 3, 2019
This chart shows hourly private sector labour costs in EU countries in 2018.
More Information
Internet Usage
May 3, 2019
This chart shows the share who say they don't use the internet but report using Facebook & WhatsApp.
More Information
Tech Giants
May 3, 2019
This chart shows the market capitalization of selected tech companies in May 2019 and May 2014.
More Information
Tech Giants
May 3, 2019
This chart shows which of the five major tech companies U.S. consumers consider industry leading across eight categories.
More Information
NSA Surveillance
May 3, 2019
This chart shows the identities of U.S. persons mentioned in intelligence reports revealed by the NSA.
More Information
Brexit
May 3, 2019
This chart shows the number of applications under the EU Settlement Scheme by nationality.
More Information
Church Tax
May 2, 2019
This chart shows the share of the public paying/not paying the church tax in 2017.
More Information
Populism
May 2, 2019
This chart shows the results of far-right parties in the most recent legislave elections (share of vote).
More Information
Digital Disconnect
May 2, 2019
This chart shows the estimated number of profiles of deceased individuals on Facebook in 2100 (millions).
More Information
NSA
May 2, 2019
This chart shows the estimated number of records collected from phone companies by the NSA.
More Information
Working Hours
Apr 30, 2019
This chart shows the average annual hours worked per worker in 2017 (selected countries).
More Information
Automation
Apr 30, 2019
This chart shows the projected decline in employment in U.S. jobs by 2024.
More Information
Japanese Imperial House
Apr 30, 2019
This chart shows the longest reigning emperors and empresses in Japan since 539.
More Information
Box Office Revenue
Apr 29, 2019
This chart shows the top ten movies by first weekend release box office revenue worldwide (in million U.S. dollars)
More Information
Health
Apr 29, 2019
This chart shows the share of 6 to 9 year olds considered obese in European countries.
More Information
New Survey
Apr 29, 2019
This chart shows the share of UK adults saying they think certain science-based conspiracy theories are true in 2019.
More Information
Lobbying in the EU
Apr 29, 2019
This chart shows self-reported annual lobbying expenditure in the European Union.
More Information
Oil & Gas Investment
Apr 29, 2019
This chart shows the top-10 companies by forecast capital expenditure in new fields from 2020 to 2029.
More Information
SVOD Competition
Apr 29, 2019
This chart shows the percent that think Disney+ will influence their use of Netflix by parental status.
More Information
Most Indebted Countries
Apr 29, 2019
This chart shows the countries with the highest government debt as a percentage of GDP in 2017.
More Information
Rent
Apr 29, 2019
This chart shows the affordablity of the private Australian housing market for people on different incomes.
More Information
Stress
Apr 29, 2019
This chart shows the share of the population that experienced a lot of stress yesterday (2018).
More Information
SVOD Competition
Apr 26, 2019
This chart shows the percent that think the release of Disney+ will affect Netflix use.
More Information
Health
Apr 26, 2019
This chart shows cancer incidence rates per 100,000 population in England in 2017, by region.
More Information
Politics
Apr 26, 2019
This chart shows the share of Britons aware of the following in 2019.
More Information
Music Videos
Apr 26, 2019
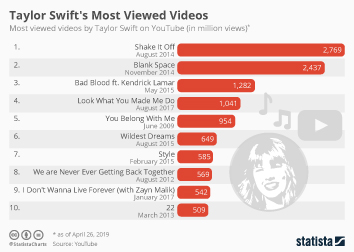
This chart shows the most watched videos of singer Taylor Swift on YouTube, as of April 26, 2019.
More Information
Amazon.com
Apr 26, 2019
This chart shows Amazon's operating profit in the AWS segment and in total.
More Information
Afghanistan
Apr 26, 2019
This chart shows civilian deaths in Afghanistan by parties to the conflict (Jan-Mar 2019).
More Information
Air Pollution
Apr 25, 2019
This chart shows metropolitan areas by average year-round concentration of particulate matter (2015-17).
More Information
PayPal vs. eBay
Apr 25, 2019
This chart compares the quarterly revenue of PayPal and eBay.
More Information
Soccer
Apr 25, 2019
This chart shows the top-ten fastest goals in Premier League history.
More Information
Notre Dame
Apr 25, 2019
This chart shows money pledged for repairs and maximum estimated repair costs.
More Information
Air Pollution
Apr 25, 2019
This chart shows the number of people living where air pollution levels are dangerously high.
More Information
Health
Apr 25, 2019
This chart shows high-income countries where the most children received no first measles vaccine from 2010 to 2017.
More Information
Air Pollution
Apr 24, 2019
This chart shows the estimated number of people in the U.S. living in areas with unhealthy air, between 2012 and 2017.
More Information
Internet Access
Apr 24, 2019
This chart shows the number of government internet shutdowns/disruptions worldwide between 2011 and 2018
More Information
Apr 24, 2019
This chart shows key financial figures for Harley Davidson in Q1 2019 and compared to Q1 2018.
More Information
Twitter
Apr 24, 2019
This chart shows Twitter's user growth since 2010.
More Information
Twitter
Apr 24, 2019
This chart shows the share of all tweets created by U.S. adults between Nov 21-Dec 27, 2018*
More Information
Pensioners
Apr 24, 2019
This chart shows the number of Australian pensioners returning to the workforce.
More Information
National savings
Apr 24, 2019
This chart shows net borrowing and lending in selected OECD countries.
More Information
Iran
Apr 24, 2019
This chart shows oil imports from Iran in March 2019 (barrels per day)*.
More Information
Road Safety
Apr 23, 2019
This chart shows the percent of trips that involved speeding, by U.S. city.
More Information
Student Debt
Apr 23, 2019
This chart shows the average student loan debt by state in U.S. dollars.
More Information
U.S. Politics
Apr 23, 2019
This chart shows the approval rating of U.S. President Donald Trump.
More Information
Lok Sabha
Apr 23, 2019
This chart shows survey responses of rural and urban Indians about the state of the economy between 2016 and 2018.
More Information
Passwords
Apr 23, 2019
This chart shows the most commonly re-occurring teams used as passwords in cyber breaches in 2019
More Information
Bombings in Sri Lanka
Apr 23, 2019
This chart shows the development of international tourism in Sri Lanka between 2014 and 2018.
More Information
Passwords
Apr 23, 2019
This chart shows the most commonly re-occurring passwords in cyber breaches in 2019.
More Information
STEM
Apr 23, 2019
THis chart shows U.S. metropolitan areas with the highest percentage of STEM jobs in 2017.
More Information
Netflix Earnings
Apr 18, 2019
This chart shows the quarterly free cash flow for Netflix between Q1 2014 to Q1 2019.
More Information
Mueller Report
Apr 18, 2019
This chart shows the percent of people that think the Mueller report should be released to Congress and the public.
More Information
Marketing Campaigns
Apr 18, 2019
This chart shows the share of the businesses that report that the barriers to the success of hyper-personalisation strategy.
More Information
Gun Violence
Apr 18, 2019
This chart shows the number of reported school shootings in the United States since 2013.
More Information
Spam
Apr 18, 2019
Top ten countries from which spam originated in 2018.
More Information
20th Anniversary
Apr 18, 2019
This chart shows deaths and injuries due to school shootings in the United States since April 21, 1999.
More Information
Tech Company IPOs
Apr 18, 2019
This chart show IPO valuations of selected tech companies.
More Information
Easter Eggs
Apr 18, 2019
This chart shows the number of teaspoons of sugar in popular Easter eggs sold in the UK & Ireland in 2019.
More Information
Media Consumption
Apr 17, 2019
This chart shows the medium that voters are most likely to first learn about political candidates/issues
More Information
Parents Online
Apr 17, 2019
This chart shows the percent of respondents who engage in select digital activities after putting kids to sleep.
More Information
Apr 17, 2019
This chart shows EU chocolate production in 2017 (million tonnes).
More Information
Statista Digital Economy Compass
Apr 17, 2019
This chart shows total worldwide venture capital invested in blockchain companies from 2013 to 2018.
More Information
Measles
Apr 17, 2019
This chart shows countries by number of confirmed measles cases from January to April.
More Information
ePublishing
Apr 16, 2019
This chart shows the revenue forecast and growth rate (in billion USD) for ePublishing in selected countries.
More Information
Pay-TV
Apr 16, 2019
This chart shows the number of subscribers of the largest Pay-TV providers in the United States at the end of Q4 2018.
More Information
Statista Digital Economy Compass
Apr 16, 2019
This chart shows the actual and forecast amount of data created worldwide from 2010 to 2035.
More Information
Statista Digital Economy Compass
Apr 16, 2019
This chart shows selected capacity comparisons for the amount of data created worldwide in 2018.
More Information
Pay-TV
Apr 16, 2019
This chart shows net subscriber loss of the largest pay-TV providers in the United States.
More Information
Facebook
Apr 16, 2019
This chart shows Facebook's security spending for Mark Zuckerberg and his family by year.
More Information
Notre Dame Fire
Apr 16, 2019
This chart shows some of the key figures behind the Notre Dame Cathedral.
More Information
Health
Apr 16, 2019
This chart shows the countries with the highest increases in measles cases from 2017 to 2018.
More Information
Stratolaunch
Apr 15, 2019
This chart shows ten of the world's largest aircraft by wingspan in feet.
More Information
Tax Refunds
Apr 15, 2019
This chart shows how Americans that expect a tax refund this year plan to spend the money.
More Information
97
/
161
Contact
Get in touch with us. We are happy to help.
Do you still have questions?
Feel free to contact us anytime using our
contact form
or visit our
FAQ page
.
Your contact to the Infographics Newsroom
Felix Richter
Data Journalist
felix.richter@statista.com
+49 (40) 284 841 557