Skip to main content
Consumer Goods & FMCG
E-Commerce
Economy & Politics
Energy & Environment
Health, Pharma & Medtech
Internet
Media
Technology & Telecommunications
Transportation & Logistics
Travel, Tourism & Hospitality
View all industries
Global data volume growth
Global AI market size
Number of generative AI users worldwide
Global inflation rate
Retail e-commerce sales worldwide
Largest economies worldwide
Biggest social media platforms by users
Global EV market share by manufacturer
International tourist arrivals by world region
Global annual CO₂ emissions
Browse recent statistics
Artificial intelligence (AI) worldwide
TikTok
Nvidia
E-commerce worldwide
Global GDP
Instagram
Apparel market worldwide
Video gaming worldwide
Global renewable energy industry
Influencer marketing worldwide
Browse recent topics
Consumer Trends 2026
Artificial Intelligence: in-depth market analysis
E-commerce challenges
Global economy
TikTok
Luxury goods: in-depth market analysis
Electric vehicles: A global overview
Video gaming worldwide
Travel and tourism trends 2026
Battery recycling worldwide
Browse recent reports
Explore the tool
Explore Classic mode
Advertising & Media
eCommerce
Consumer
Finance
Global Indicators
Health
Industrial
Mobility
Technology
Explore Market Insights
eCommerce Insights
Research AI
Book a demo
All integrations
Developer docs
Explore Statista Connect
Research
Strategy & Consulting
Marketing
Media & PR
Explore AI assistants
Marketing
Research & Development
Strategy
Sales
Find the fact
Tell the story
Win the pitch
Understand the market
Develop your strategy
Academia
Agencies
Consultancies
Consumer goods
Finance
Tech
Research solutions
Strategy consulting
Communication services
Explore Statista+
Statista R
Statista Healthcare
About Statista
First steps & help center
Webinar & training hub
Success stories
Individuals & Small Teams
Businesses & Enterprises
Academia & Government
English
Deutsch
Daily Data
Global stories vividly visualized
United Kingdom
Mar 28, 2019
This chart shows the Conservative MPs of which the most people in the UK have a favourable view in 2019.
More Information
Energy Use
Mar 28, 2019
This chart shows the annual increase in global energy demand 2011-2018 as well as the make-up of the 2018 increase by country/region...
More Information
UK Politics
Mar 28, 2019
This chart shows the results of votes on alternative Brexit proposals on 27 March 2019.
More Information
Gun Lobby
Mar 27, 2019
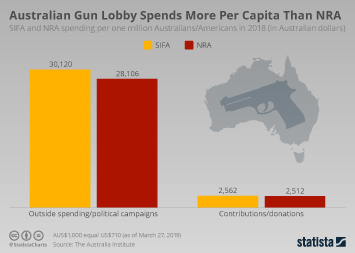
This chart shows per capita spending by the National Rifle Association in the U.S. and the Australian gun lobby SIFA.
More Information
NASA
Mar 27, 2019
This chart shows NASA's budget share of the U.S. federal budget from 1958 to 2017.
More Information
Artificial Intelligence
Mar 27, 2019
This chart shows the types of artificial intelligence (AI) applications used in companies in the United States.
More Information
Cloud Gaming
Mar 27, 2019
This chart shows the cloud gaming market value worldwide from 2017 to 2023 (in millions of U.S. dollars).
More Information
Airbnb
Mar 27, 2019
This chart shows the breakdown of the U.S. consumer lodging market by lodging company between 2013 to 2018.
More Information
Economy
Mar 27, 2019
This chart shows the share willing to pay an extra 2% tax to fund better provision/access for public services in OECD countries.
More Information
Marijuana
Mar 27, 2019
This chart shows estimated 2018 tax revenue in states where recreational marijuana use is legal.
More Information
Automation
Mar 27, 2019
This chart shows the share of jobs with the highest and lowest risk from automation in England in 2017.
More Information
STEM
Mar 26, 2019
This chart shows the percent of respondents that say science and technology will have a positive impact solving the country's biggest...
More Information
Subscription Services
Mar 26, 2019
This chart shows the most popular paid subscription service categories in the U.S. in 2018.
More Information
Virtual Reality
Mar 26, 2019
This chart shows the share of Americans familiar with VR and perceived barriers to adoption.
More Information
Climate Lobbying
Mar 26, 2019
This chart shows annual expenditure on climate lobbying by oil and gas companies.
More Information
Streaming Services
Mar 25, 2019
This chart shows the estimated share of SVoD users in the total population.
More Information
Game Consoles
Mar 25, 2019
This chart shows the unit sales of video game consoles worldwide from 2008 to 2018.
More Information
Marijuana Industry
Mar 25, 2019
This chart shows the number of new jobs added in the U.S. cannabis industry by state in 2018.
More Information
Brands
Mar 25, 2019
This infographic displays the worldwide media perception of four of the largest Dutch brands in 2018.
More Information
Brexit
Mar 25, 2019
This chart shows the top-10 countries with the most signatures outside the UK.
More Information
International Worries
Mar 22, 2019
This chart shows the percent of people that identify each risk as one of their top three short term risks, by country in 2018.
More Information
Seasonal Allergies
Mar 22, 2019
This chart shows the U.S. cities suffering the most from allergies in spring 2019.
More Information
Native Video
Mar 22, 2019
This chart shows the average engagements on top Facebook posts, by content type.
More Information
Levi Strauss Co.
Mar 22, 2019
This chart shows the market capitalization of selected U.S. apparel companies.
More Information
March Madness
Mar 22, 2019
This chart compares TV ad spending during March Madness to post-season ad spending for other sports leagues.
More Information
Streaming
Mar 22, 2019
This chart shows the share of U.S. households with the following subscriptions in 2018.
More Information
International Students
Mar 21, 2019
This chart shows post-graduation tax revenues associated with international students in 2016/17.
More Information
Apple
Mar 21, 2019
This chart shows Apple's non-iPhone revenue by product group for the fiscal years 2015 to 2018.
More Information
Energy Mix
Mar 21, 2019
This chart shows primary energy consumption in the U.S., the UK, Australia and Canada.
More Information
Apple iPad
Mar 21, 2019
This chart shows Apple's worldwide iPad unit sales since 2010.
More Information
Venture Capital
Mar 20, 2019
This chart shows the distribution of venture capital investments in 2018 by U.S. region.
More Information
Spirits
Mar 20, 2019
This chart shows the value of whiskey exports from Japan.
More Information
Demographics
Mar 19, 2019
This chart shows the mean age of women at birth of first child in European countries in 2017.
More Information
Cost of Living
Mar 19, 2019
This chart shows the cities worldwide with the lowest cost of living in 2019.
More Information
Product Piracy
Mar 19, 2019
This chart shows the percentage of total value of seized counterfeit and pirated goods worldwide in 2016, by industry.
More Information
Plastic Waste
Mar 19, 2019
This chart shows the annual amount of plastic waste produced by selected companies.
More Information
Counterfeit and pirated products
Mar 19, 2019
This chart shows the percentage of total value of seized counterfeit/pirated goods worldwide between 2014 and 2016, by country of copyright...
More Information
Smart Home
Mar 18, 2019
This chart shows smart home revenue and penetration rate in 2018, by country.
More Information
Ariticial Intelligence
Mar 18, 2019
This chart shows the percent of the general population vs. tech executives that are aware of various AI uses.
More Information
Music Industry
Mar 18, 2019
This chart shows the gender distribution of site traffic as a percent of total traffic.
More Information
NCAA
Mar 18, 2019
This chart shows survey responses about March Madness in the workplace.
More Information
Entertainment Industries
Mar 18, 2019
This chart shows entertainment industry revenue in the United States in 2018, by segment.
More Information
Social Media
Mar 18, 2019
This chart shows the global monthly traffic to myspace.com
More Information
Campaign Finance
Mar 18, 2019
This chart shows how much Democratic primary candidates raised in the first days after their presidential campaign announcements.
More Information
Uighur
Mar 18, 2019
This chart presents Chinese government statistics on the state's 'anti-terror' activity in Xinjiang since 2014.
More Information
Social Media
Mar 18, 2019
This chart shows social media activity on the Twitter and Facebook accounts of U.S. President Donald Trump and Brazilian President...
More Information
Video Games
Mar 18, 2019
This chart shows which gaming platforms are currently getting the most support from game developers.
More Information
Celebrities on Social Media
Mar 15, 2019
This chart shows selected artists' social media presences by looking at their followers.
More Information
Immigration
Mar 15, 2019
This chart shows the opinion of citizens in 18 immigration countries about newcomers to those countries.
More Information
Death Penalty
Mar 15, 2019
This chart shows the states with most death row inmates and the legality of the death penalty, by state.
More Information
Social Media
Mar 15, 2019
This chart shows global monthly traffic to tumblr.com from September 2018 to February 2019.
More Information
Pi Day
Mar 14, 2019
This chart shows facts about Pi Day.
More Information
Comic Relief
Mar 14, 2019
This chart shows the total amount raised by Red Nose Day in the UK from 2001 to 2017.
More Information
Retail Apocalypse
Mar 14, 2019
This chart shows which U.S. chains have announced the most store closures for 2019 (as of March 14, 2019).
More Information
Crisis in Venezuela
Mar 14, 2019
This chart shows the GDP of Venezuela from 1990 to 2023 under the Chávez and Maduro administrations.
More Information
Ethopian Airline Crash
Mar 14, 2019
This chart shows Boeing's worldwide aircraft orders and deliveries in 2018, by aircraft type.
More Information
Workplace Culture
Mar 13, 2019
This chart shows the top workplace distractions cited by workers.
More Information
Content Moderation
Mar 13, 2019
This chart shows the overview of Facebook content moderator pay and jobs.
More Information
Energy Mix
Mar 13, 2019
This chart shows the energy consumption mix in Australia and other selected countries (2016/17 or latest available).
More Information
Price Index
Mar 13, 2019
This chart shows the development of the consumer price index in Japan from 2019 and the year-on-year price index increase of selected...
More Information
Ship Scrapping
Mar 13, 2019
This chart shows the locations in which most ships are scrapped worldwide as well as the countries of the shipowners.
More Information
Brexit
Mar 13, 2019
This chart presents selected forecasts related to the impact of the UK exiting the EU without a deal.
More Information
Taxes
Mar 12, 2019
This chart shows the share of Americans who plan to save their tax refunds from 2009 to 2019.
More Information
Economic Policy
Mar 12, 2019
This chart shows the percent of people that indicate which economic issue is the bigger problem in the United States: inequality or...
More Information
Superhero Films
Mar 12, 2019
This chart shows the worldwide ticket sales for opening weekend (in millions of U.S. dollars).
More Information
St. Patrick's Day
Mar 12, 2019
This chart shows key numbers and trends behind St. Patrick's Day.
More Information
Global Politics
Mar 12, 2019
This chart shows the global approval ratings for the Chinese and U.S. political leadership from 2007 to 2018.
More Information
New Research
Mar 12, 2019
This chart shows estimated annual global deaths attributable to air pollution and smoking.
More Information
Luxury Assets
Mar 12, 2019
This chart shows the 10-year change in the value of selected popular luxury assets (as of Q4, 2018).
More Information
Plastic Surgery
Mar 12, 2019
This chart shows cosmetic surgery procedures in the United States in 2018.
More Information
Internet Access
Mar 11, 2019
This chart shows the global penetration rate from 209 to 2018, by region.
More Information
Internet
Mar 11, 2019
This chart shows a distribution of global downstream mobile traffic, by app.
More Information
Cloud market share
Mar 11, 2019
This chart shows market share figures for the cloud infrastructure market.
More Information
Plastic Bans
Mar 11, 2019
This chart shows the share of countries that have enacted plastic bans/restrictions and the types of restrictions they implemented.
More Information
Arms Trade
Mar 11, 2019
This chart shows the share of global arms exports by country from 2014 to 2018.
More Information
Crisis in Venezuela
Mar 11, 2019
This chart shows the amount of oil produced in Venezuela and the number of oild rigs active from 2012 until the start of 2019.
More Information
Ethiopian Airlines Crash
Mar 11, 2019
This chart shows the number of 737 MAX jets that have been grounded by airline*
More Information
United Kingdom
Mar 11, 2019
Stated reasons people are 'quite' or 'very' dissatisfied with the NHS in 2019.
More Information
Retail
Mar 11, 2019
This chart shows the share of point of sale purchases using cash by households in selected European countries.
More Information
Facebook
Mar 11, 2019
This chart shows the share of the U.S. population using Facebook by age group.
More Information
Advertising
Mar 8, 2019
This chart shows that net advertising spending in the United Kingdom (UK) from 2005 to 2019 in millions of pounds.
More Information
Iditarod
Mar 8, 2019
This chart shows recent Iditarod winners by year and finishing time (in days: hours: minutes: seconds).
More Information
Trump Administration
Mar 8, 2019
This chart shows the percent that think President Trump committed any crimes before or during his presidency.
More Information
Women's Day
Mar 8, 2019
This chart shows the percent of women who selected a female figure that made the most important impact on U.S. history.
More Information
Female Representation
Mar 8, 2019
This chart shows the number of public statues depicting men and women in the U.S. and the U.K.
More Information
Podcasts
Mar 8, 2019
This chart shows the largest podcast publishers in the United States.
More Information
Female Managers
Mar 8, 2019
This chart shows the share of female senior executives and managers in EU countries.
More Information
Military Draft
Mar 8, 2019
This chart shows the number of women enlisted in the U.S. military (active-duty and reserve) als well as age groups subject to the...
More Information
Data Storage
Mar 8, 2019
This chart shows the percent of merchants and billing organization admit payment data has been stolen.
More Information
Tinder revenue
Mar 8, 2019
This chart shows the net revenue of the Tinder app on the Apple App Store and Google Play Store in 2018 in different European countries.
More Information
99
/
161
Contact
Get in touch with us. We are happy to help.
Do you still have questions?
Feel free to contact us anytime using our
contact form
or visit our
FAQ page
.
Your contact to the Infographics Newsroom
Felix Richter
Data Journalist
felix.richter@statista.com
+49 (40) 284 841 557