
- Internet›
- Social Media & User-Generated Content›
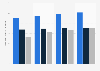
Share of U.S. teenagers who use Snapchat 2015, by gender and age
Percentage of teenagers in the United States who use Snapchat as of March 2015, by gender and age group

Share of respondents | |
---|---|
Boys 13-14 | 19% |
Boys 15-17 | 39% |
Girls 13-14 | 43% |
Girls 15-17 | 56% |
Share of respondents | |
---|---|
Boys 13-14 | 19% |
Boys 15-17 | 39% |
Girls 13-14 | 43% |
Girls 15-17 | 56% |
© Statista 2019
About this statistic
Show source
Please be patient - this may take a moment
Description
Source
More information
- Show sources information
- Show publisher information
- Release date
- April 2015
- Region
- United States
- Survey time period
- September 25 to October 9, 2014 and February 10 to March 16, 2015
- Number of respondents
- 1,060 respondents
- Age group
- 13 to 17 years
- Method of interview
- Online survey
- Region
- United States
- Survey time period
- September 25 to October 9, 2014 and February 10 to March 16, 2015
- Number of respondents
- 1,060 respondents
- Age group
- 13 to 17 years
- Method of interview
- Online survey


You only have access to basic statistics.
- Instant access to 1m statistics
- Download in XLS, PDF & PNG format
- Detailed references
$49 / Month *
Corporate solution including all features.
Prices do not include sales tax.


I think of Statista as Google for researchers. Statista provides you with the information you search for right away.Dr. Horst Stipp
EVP, Research & Innovation, Advertising Research Foundation
- Overview
- Global social network penetration rate as of January 2019, by regionSocial media: global penetration rate 2019, by region
- Active social network penetration in selected countries as of January 2019Social media: active usage penetration in selected countries 2019
- Number of social network users in selected countries in 2018 and 2023 (in millions)Social network users in selected countries in 2018 and 2023
- Number of social network users in the United States from 2017 to 2023 (in millions)United States: number of social network users 2017-2023
- Share of internet users in the United States with accounts on selected social media platforms as of February 2018, by age groupU.S. social media account ownership 2018, by age group
- Leading social platforms
- Most popular social networks worldwide as of January 2019, ranked by number of active users (in millions)Global social networks ranked by number of users 2019
- Penetration of leading social networks in the United States as of 3rd quarter 2017United States: social network penetration Q3 2017
- Social networks accessed several times per day by internet users in the United States as of January 2018Social networks with daily U.S. user engagement 2018
- Reach of selected social networks in the United States as of February 2017, by age groupU.S. usage reach of leading social networks 2017, by age group
- Most popular social networks of teenagers in the United States from fall 2012 to fall 2018Preferred social networks of U.S. teens 2012-2018
- Percentage of female internet users in the United States who access selected social networks as of January 2018Social networks: usage by female U.S. internet users 2018
- Social media activities
- Average daily time spent on selected social networks by adults in the United States from 2014 to 2019 (in minutes)Average daily time spent on social media by U.S. adults 2014-2019
- Average daily time spent on selected social networks by users in the United States from 2014 to 2019 (in minutes)Average daily time spent on social media by U.S. users 2019
- Social media platforms accessed by internet users in the United States to watch videos as of December 2017U.S. social media platform usage for video viewing 2017
- Types of life milestones shared on social media according to online users in the United States as of September 2017Type of milestones shared by U.S. users on social media 2017
- Reasons online users in the United States share life milestones on social media as of September 2017U.S. user reasons for sharing life milestones on social media 2017
- Share of parents in the United States who are aware of their children's social media accounts as of February 2018, by platformU.S. parental awareness of children's social media accounts 2018
- Extent to which their newsfeed has changed this year according to social media users in the United States as of October 2017Extent on newsfeed change according to U.S. social media users 2017
- Mobile social
- Social media usage as share of total mobile minutes in leading online markets as of May 2017Social share of mobile minutes in selected countries 2017
- Number of smartphone social network users in the United States from 2014 to 2020 (in millions)Number of U.S. smartphone social network users 2014-2020
- Leading apps that male mobile users in the United States least can do without as of 2nd quarter 2017Most popular apps that male U.S. mobile users cannot do without 2017
- Leading apps that female mobile users in the United States least can do without as of 2nd quarter 2017Most popular apps of female U.S. mobile users cannot do without 2017
- Average time spent per day with mobile messaging apps by adults in the United States 2015 to 2019U.S. adult daily mobile messaging app engagement 2015-2019
- Most popular mobile social networking apps in the United States as of October 2018, by monthly users (in millions)Most popular social media apps in the U.S. 2018, by audience
- Most popular social apps accessed several times a day among mobile users in the United States as of 2nd quarter 2017Most frequently accessed mobile social apps in the United States 2017
- Most popular mobile social networking apps in the United States as of October 2018, by user engagement (in minutes per month)Most popular social media apps in the U.S. 2018, by engagement
- Leading countries based on number of Facebook users as of January 2019 (in millions)Countries with the most Facebook users as of January 2019
- Facebook usage penetration in the United States from 2017 to 2023Facebook: online reach in the United States 2017-2023
- Facebook penetration in the United States from 2013 to 2020, by age groupU.S. Facebook usage penetration 2013-2020, by age group
- Number of Facebook users in the United States as of January 2018, by age group (in millions)Number of U.S. Facebook users 2018, by age
- Number of monthly active Facebook users in the United States and Canada as of 4th quarter 2018 (in millions)Facebook: number of monthly active users in North America 2010-2018
- Most popular Facebook activities in the United States as of October 2017Facebook activities of users in the United States 2017
- Distribution of Facebook users in the United States as of January 2018, by age group and genderFacebook: distribution of U.S. users 2018, by age and gender
- Frequency of Facebook use in the United States as of February 2018Facebook usage frequency in the United States 2018
- Number of Instagram users in the United States from 2017 to 2022 (in millions)Instagram: number of users in the United States 2017-2022
- Instagram penetration rate in the United States from 2017 to 2022U.S. Instagram usage rate 2017-2022
- Percentage of U.S. adults who use Instagram as of January 2018, by genderInstagram usage reach in the United States 2018, by gender
- Percentage of U.S. adults who use Instagram as of January 2018, by age groupInstagram usage reach in the United States 2018, by age group
- Percentage of U.S. adults who use Instagram as of January 2018, by educational backgroundInstagram usage reach in the United States 2018, by education
- Frequency of Instagram use in the United States as of January 2018Instagram usage frequency in the United States 2018
- Frequency of Instagram use in the United States as of February 2018, by genderInstagram usage frequency in the United States 2018, by gender
- Frequency of Instagram use in the United States as of February 2018, by age groupInstagram usage frequency in the United States 2018, by age group
- Brands on social
- Leading industries of U.S. brands on social media in 2017, by share of voiceEngagement share of voice of U.S. brands 2017, by industry
- Leading brands in the United States on social media in 2017, based on user engagement (in million actions)Leading U.S. brands on social media 2017, by user engagement
- Leading brands in the United States on Facebook in 2017, based on user engagement (in million actions)Leading U.S. brands on Facebook 2017, by user engagement
- Leading brands in the United States on Twitter in 2017, based on user engagement (in million actions)Leading U.S. brands on Twitter 2017, by user engagement
- Leading brands in the United States on Instagram in 2017, based on user engagement (in million actions)Leading U.S. brands on Instagram 2017, by user engagement
- Leading brands in the United States on social media in 2017, based on user engagement on owned video content (in million actions)Leading U.S. brands on social media 2017, by video engagement
- Reasons why consumers in the United States call out brands on social media as of July 2017U.S. consumer reasons calling out brands on social media 2017
- Most common benefits consumers in the United States hope to gain by calling out brands on social media as of July 2017U.S. consumer benefits of calling out brands on social media 2017
- Snapchat: most popular daily U.S. youth user activities 2016
- Snapchat: most popular user activities 2015
- Share of young French adults using Instagram and Snapchat by age 2018
- Snapchat usage in Denmark 2015, by age group
- Snapchat usage purposes in Finland 2017
- Snapchat: age distribution of U.S. users 2016
- U.S. youth Snapchat users following celebrities on social media 2016
- Italy: female users experience and interaction on Snapchat in 2017
- Share of U.S. cell phone users who use Snapchat in 2013, by income
- Average number of Snapchat contacts Australia 2018, by age group
- Snapchat: age distribtion of global audiences 2015
- Children's usage of Snapchat in Norway 2015, by age group and gender
- Share of U.S. cell phone users who use Snapchat in 2013, by ethnicity
- Share of U.S. cell phone users who use Snapchat in 2013, by age
- Snapchat: preferred car brands of U.S. fans 2014
- Snapchat
- Photo apps in the United Kingdom (UK)
- Internet usage of teenagers in the United States
- Teens, Social Media & Technology 2018
- Teens' Social Media Habits and Experiences
- 2018 Social Media, Social Life
- Snap Annual Report 2018
- Snap Annual Report 2017
- Social Media Use in 2018
- Social media usage in the Netherlands
- Mobile social media usage in the United States
- Snaplytics Quarterly Report Q2 2017
- Social media usage in Belgium
- Mobile messenger apps
- Social content sharing
- Active social network penetration in selected countries as of January 2019
- Number of social network users in selected countries in 2018 and 2023 (in millions)
- Number of social network users in the United States from 2017 to 2023 (in millions)
- Share of internet users in the United States with accounts on selected social media platforms as of February 2018, by age group
- Most popular social networks worldwide as of January 2019, ranked by number of active users (in millions)
- Penetration of leading social networks in the United States as of 3rd quarter 2017
- Social networks accessed several times per day by internet users in the United States as of January 2018
- Reach of selected social networks in the United States as of February 2017, by age group
- Most popular social networks of teenagers in the United States from fall 2012 to fall 2018
- Percentage of female internet users in the United States who access selected social networks as of January 2018
- Types of life milestones shared on social media according to online users in the United States as of September 2017
- Reasons online users in the United States share life milestones on social media as of September 2017
- Share of parents in the United States who are aware of their children's social media accounts as of February 2018, by platform
- Extent to which their newsfeed has changed this year according to social media users in the United States as of October 2017
- Social media usage as share of total mobile minutes in leading online markets as of May 2017
- Number of smartphone social network users in the United States from 2014 to 2020 (in millions)
- Leading apps that male mobile users in the United States least can do without as of 2nd quarter 2017
- Leading apps that female mobile users in the United States least can do without as of 2nd quarter 2017
- Average time spent per day with mobile messaging apps by adults in the United States 2015 to 2019
- Most popular mobile social networking apps in the United States as of October 2018, by monthly users (in millions)
- Most popular social apps accessed several times a day among mobile users in the United States as of 2nd quarter 2017
- Most popular mobile social networking apps in the United States as of October 2018, by user engagement (in minutes per month)
- Most popular mobile social networking apps in the United States as of October 2018, by average session duration (in minutes)
- Most popular mobile social networking apps in the United States as of October 2018, by reach
- Most popular mobile social networking apps in the United States as of October 2018, by number of monthly sessions
- Leading countries based on number of Facebook users as of January 2019 (in millions)
- Facebook usage penetration in the United States from 2017 to 2023
- Facebook penetration in the United States from 2013 to 2020, by age group
- Number of monthly active Facebook users in the United States and Canada as of 4th quarter 2018 (in millions)
- Most popular Facebook activities in the United States as of October 2017
- Distribution of Facebook users in the United States as of January 2018, by age group and gender
- Frequency of Facebook use in the United States as of February 2018
- Frequency of Facebook use in the United States as of February 2018, by gender
- Frequency of Facebook use in the United States as of February 2018, by age group
- Percentage of U.S. adults who use Facebook as of January 2018, by gender
- Percentage of U.S. adults who use Facebook as of January 2018, by age group
- Reasons for internet users in the United States to not use Facebook as of October 2017
- Percentage of U.S. adults who use Instagram as of January 2018, by gender
- Percentage of U.S. adults who use Instagram as of January 2018, by age group
- Percentage of U.S. adults who use Instagram as of January 2018, by educational background
- Frequency of Instagram use in the United States as of January 2018
- Frequency of Instagram use in the United States as of February 2018, by gender
- Frequency of Instagram use in the United States as of February 2018, by age group
- Leading brands in the United States on Twitter in 2017, based on user engagement (in million actions)
- Leading brands in the United States on social media in 2017, based on user engagement on owned video content (in million actions)
- Reasons why consumers in the United States call out brands on social media as of July 2017
- Most common benefits consumers in the United States hope to gain by calling out brands on social media as of July 2017
- Most popular daily activities of teen and young adult Snapchat users in the United States as of February 2016
- Most popular activities of Snapchat users worldwide as of 3rd quarter 2015
- Distribution of Snapchat users in the United States as of February 2016, by age
- Preferred social networks to follow celebrities according to teen and young adult Snapchat users in the United States as of February 2016
- Distribution of Snapchat users worldwide as of 2nd quarter 2015, by age
- Car brands favored by Snapchat fans in the United States as of August 2014
- Global social network penetration rate as of January 2019, by region
- Average daily time spent on selected social networks by adults in the United States from 2014 to 2019 (in minutes)
- Average daily time spent on selected social networks by users in the United States from 2014 to 2019 (in minutes)
- Social media platforms accessed by internet users in the United States to watch videos as of December 2017
- Number of Facebook users in the United States as of January 2018, by age group (in millions)
- Number of Instagram users in the United States from 2017 to 2022 (in millions)
- Instagram penetration rate in the United States from 2017 to 2022
- Fastest-growing influencers on Instagram in the United States as of January 2018, based on follower growth in the past 4 weeks
- Most-followed fashion and beauty influencers on Instagram in the United States as of July 2018
- Most-followed travel influencers on Instagram in the United States as of November 2018
- Leading industries of U.S. brands on social media in 2017, by share of voice
- Leading brands in the United States on social media in 2017, based on user engagement (in million actions)
- Leading brands in the United States on Facebook in 2017, based on user engagement (in million actions)
- Leading brands in the United States on Instagram in 2017, based on user engagement (in million actions)
- Percentage of French aged between 16 and 25 years old using Instagram and Snapchat in 2018, distributed by age group
- Share of Snapchat users in Denmark in 2015, by age group
- Purposes of Snapchat usage in Finland in 2017
- Female users experience and interaction on Snapchat in Italy in 2017
- Percentage of U.S. cell phone users who used Snapchat in October 2013, by income
- Average number of Snapchat contacts in Australia as of April 2018, by age group
- Share of children who used Snapchat in Norway in 2015, by age group and gender
- Percentage of U.S. cell phone users who use Snapchat in October 2013, by ethnicity
- Percentage of U.S. cell phone users who use Snapchat in October 2013, by age
Statista offers dossiers and reports on over 170 industries. With Statista you are always able to make informed decisions and boost your work efficiency.
Internet & Telecommunications
- Social Media
- E-Commerce
- Online Video & Entertainment
- Advertising & Marketing
Consumer Goods & FMCG
- Alcoholic Beverages
- Cleaning Products
- Cosmetics & Personal Care
- Food & Nutrition
Retail & Trade
- Health & Hygiene
- International Trade
- Shopping Behavior
- Sports & Leisure
Travel, Tourism & Hospitality
- Business Travel
- Leisure Travel
- Accomodation
- Restaurants
Society
- Demographics
- Economy
- Education & Science
- Politics & Government
Transportation & Logistics
- Aviation
- Rail Transport
- Vehicles & Road Traffic
- Water Transport
Register in seconds and access exclusive features.
Basic Account |
Instant Access
Premium Account | ||
---|---|---|---|
Our servicesClick the question mark for further information | Free |
$49 per month* | |
Basic statistics | |||
Premium statistics | |||
Graph download
| |||
Download PDF | |||
Excel download
| |||
Register | Purchase now |
This feature is limited to our corporate solutions.
Please contact us to get started with full access to dossiers, forecasts, studies and international data.

The global plastics industry is growing by approximately three percent every year. This dossier provides information about the global plastics industry in general as well as chapters on the major types of plastic, and recycling rates.

Updates on eCommerce, Digital Media, eTravel, eServices and more
- Market figures for 2018 to 2023
- Company and startup profiles
- User demographics

U.S. coal production has steadily declined in the past decade, but has been in the news in recent years due to President Trump's desire to revitalize the industry. This document provides an overview of the key figures, leading companies, and the employment trends in the U.S. coal mining industry.

This new export feature offers
- Structured graphical representation of the data
- Tailored target group analysis
- Option for further processing

The Polish e-commerce market is one of the fastest developing e-commerce markets in Europe. The latest data for Poland is presented in this dossier.

Plastic waste is an issue of global concern. Since China banned the import of recycled plastic, the U.S. has had to make adjustments to its management of plastic waste. This dossier provides an overview of plastic waste in the U.S.

This dossier provides an overview of hedge funds worldwide. Global hedge fund assets, performance, investors, and other topics are highlighted.

The Outdoor Advertising Association of America covers amongst others
- Number of billboards
- Outdoor advertising revenue
- Number of out-of-home displays

Find data, perceptions & more about
- Economic consequences
- Impact on the labor market
- A second referendum

Understand the recent developments in the Spanish eCommerce market!
- URL-related revenues
- Relevant online store KPIs
- eCommerce-related contacts

- Extended statistical dossier
- Insights, explanations & interpretations
- Challenges of the digital future

eCommerce is rapidly becoming a part of the Latin American shopping culture. The dossier includes data on
- Regional online shopping events
- Events by country

The outline of potential impacts of Brexit on UK industries has been updated in the UK Industry Reports.

Italian enterprises invest significantly in digital marketing. Find out about
- Relevant aspects & KPIs
- New trends
- Different strategies

Statista European Football Benchmark
- The big 5 European leagues
- All about the clubs & fans
- Sponsors & how they fit in

What are online shoppers' payment preferences around the world?
- Data on all payment methods
- Analysis for 50 countries
- Forecasts up to 2023
We use cookies to personalize contents and ads, offer social media features, and analyze access to our website. In your browser settings you can configure or disable this, respectively, and can delete any already placed cookies. For details, please see your browser’s Help section (by pressing F1). Please see our privacy statement for details about how we use data.