Skip to main content
Consumer Goods & FMCG
E-Commerce
Economy & Politics
Energy & Environment
Health, Pharma & Medtech
Internet
Media
Technology & Telecommunications
Transportation & Logistics
Travel, Tourism & Hospitality
View all industries
Global data volume growth
Global AI market size
Number of generative AI users worldwide
Global inflation rate
Retail e-commerce sales worldwide
Largest economies worldwide
Biggest social media platforms by users
Global EV market share by manufacturer
International tourist arrivals by world region
Global annual CO₂ emissions
Browse recent statistics
Artificial intelligence (AI) worldwide
TikTok
Nvidia
E-commerce worldwide
Global GDP
Instagram
Apparel market worldwide
Video gaming worldwide
Global renewable energy industry
Influencer marketing worldwide
Browse recent topics
Consumer Trends 2026
Artificial Intelligence: in-depth market analysis
E-commerce challenges
Global economy
TikTok
Luxury goods: in-depth market analysis
Electric vehicles: A global overview
Video gaming worldwide
Travel and tourism trends 2026
Battery recycling worldwide
Browse recent reports
Explore the tool
Explore Classic mode
Advertising & Media
eCommerce
Consumer
Finance
Global Indicators
Health
Industrial
Mobility
Technology
Explore Market Insights
eCommerce Insights
Research AI
Book a demo
All integrations
Developer docs
Explore Statista Connect
Research
Strategy & Consulting
Marketing
Media & PR
Explore AI assistants
Marketing
Research & Development
Strategy
Sales
Find the fact
Tell the story
Win the pitch
Understand the market
Develop your strategy
Academia
Agencies
Consultancies
Consumer goods
Finance
Tech
Research solutions
Strategy consulting
Communication services
Explore Statista+
Statista R
Statista Healthcare
About Statista
First steps & help center
Webinar & training hub
Success stories
Individuals & Small Teams
Businesses & Enterprises
Academia & Government
English
Deutsch
Daily Data
Global stories vividly visualized
Video Games
Jun 12, 2017
This chart shows how owners of video game consoles in the United States use their devices.
More Information
Corruption In Russia.
Jun 12, 2017
This chart shows Russian attitudes towards high-level government corruption.
More Information
Russia
Jun 12, 2017
This chart shows the approval ratings of the president and government in Russia.
More Information
Digital Communication
Jun 12, 2017
This chart shows average connection speed (IPv4) by state in Q1 2017
More Information
French Election
Jun 12, 2017
This chart shows the share of total votes in the first round of parliamentary elections in France in 2017.
More Information
U.S. Food Retail
Jun 9, 2017
This graphic shows the top worldwide food retailers and the top U,S, supermarkets based on retail sales in billion U.S. dollars for...
More Information
Women
Jun 9, 2017
This chart shows the percentage of respondents agreeing with the following statements.
More Information
2017 UK General Election
Jun 9, 2017
This chart shows seats won and share of votes received in the 2017 UK general election.
More Information
UK General Election 2017
Jun 9, 2017
This chart shows results of the general election in the United Kingdom 2017
More Information
Credibility of news media
Jun 8, 2017
This chart shows how credible Americans think selected news organizations are.
More Information
Religion In The UK
Jun 8, 2017
This chart shows the percentage identifying as having "no religion" by region in the UK in 2015.
More Information
Electric Mobility
Jun 8, 2017
This chart shows new registrations and market share of electric cars worldwide.
More Information
Donald Trump
Jun 8, 2017
This chart shows selected character traits and standpoints attributed to U.S. President Donald Trump
More Information
Comey Testimony
Jun 8, 2017
This chart shows responses to the question: "how much do you trust Trump/Comey on Russian interference in the 2016 election?"
More Information
Social Media
Jun 8, 2017
This chart shows the share of registered U.S. voters who think Trump is tweeting to much
More Information
2017 UK General Election
Jun 8, 2017
This chart shows responses to the question: "how would you vote if there was a general election tomorrow".
More Information
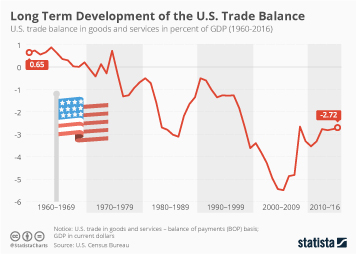
U.S. Trade Balance
Jun 8, 2017
This chart shows the U.S. trade balance in goods and services in percent of GDP (1960-2016)
More Information
Employment
Jun 8, 2017
This chart shows the number of employees in the coal mining sector in the United States since 2007 (in 1,000)
More Information
Jun 7, 2017
This chart shows wireless audio brands preferred by custom electronics installation professionals in the United States.
More Information
Technology use by U.S. teens
Jun 7, 2017
This chart shows how long U.S. teens think they can go without communication devices.
More Information
Irish Penalty Points
Jun 7, 2017
This chart shows penalty point notices in Ireland broken down by age and gender.
More Information
Infrastructure
Jun 7, 2017
Funding needs of major infrastructure sectors in the U.S. 2016 to 2025
More Information
UK General Election
Jun 7, 2017
This chart shows the number of police officers in England and Wales from 2010 to 2016.
More Information
Paris Climate Agreement
Jun 7, 2017
This chart shows U.S. states & cities saying they are "still in" on the Paris Agreement.
More Information
UK General Election
Jun 7, 2017
This chat shows the voting intentions and seat estimates before the UK general election 2017
More Information
Government Finance
Jun 7, 2017
This chart shows the United Kingdom government revenue and spending from 2010 to 2020 (in billion pounds)
More Information
Irish Penalty Points
Jun 6, 2017
This chart shows the Irish countries where you have the highest chances of getting penalty points.
More Information
Paris Agreement
Jun 6, 2017
This chart shows the % of Americans who support/oppose Trump's decision to withdraw from the Paris agreement.
More Information
Apple WWDC 2017
Jun 6, 2017
This chart compares retail prices of selected wireless speakers, voice-enabled and not, in the United States.
More Information
Global Peace Index 2017
Jun 6, 2017
This chart shows countries by ranked by peace level in 2017.
More Information
Foreign Trade
Jun 6, 2017
This chart shows the most important foreign trading partners of Qatar by share of trade volume 2015
More Information
Blue Apron IPO
Jun 2, 2017
This chart shows revenue and net losses of food delivery company Blue Apron.
More Information
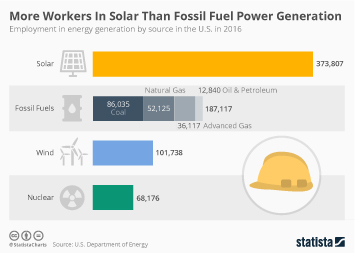
Energy
Jun 2, 2017
This chart shows employment in energy generation by source in the U.S. in 2016.
More Information
Paris Agreement
Jun 2, 2017
Percentage of Americans by state who supported participation in the Paris agreement in 2016.
More Information
Paris Agreement
Jun 2, 2017
This chart shows the percentage saying global warming is a very serious problem.
More Information
Global Peace Index
Jun 1, 2017
This chart shows countries ranked by peace level in 2017.
More Information
Social Media Marketing
Jun 1, 2017
This chart shows consumer sentiment on brand behavior on social media.
More Information
War & Conflict
Jun 1, 2017
This chart shows causes of civilian deaths and injuries in Afghanistan and which groups are responsible most often
More Information
Environment
Jun 1, 2017
This chart shows global greenhouse gas emission from fossil fuel combustion by country and emission by economic sector
More Information
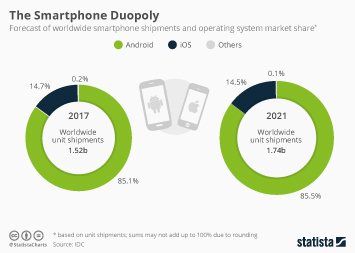
Smartphone platform market share
May 31, 2017
This chart shows a forecast of worldwide smartphone shipments and operating system market share.
More Information
Foreign Trade
May 31, 2017
This chart shows U.S. trade in goods with Germany (in nominal billion U.S. dollars)
More Information
Statista Hotels Survey
May 31, 2017
This chart shows the hotel services which trip bookers care the most about.
More Information
Trump/Paris Agreement
May 31, 2017
This chart shows the countries/regions with the most governmental renewable energy R&D spending in 2016.
More Information
World No Tobacco Day
May 31, 2017
This chart shows total lobbying on tobacco in the United States from 2007 to 2017.
More Information
UK General Election
May 31, 2017
This chart shows the projected distribution of parliament seats after the UK general election 2017.
More Information
Housing Market
May 31, 2017
This chart displays the average price change per month of a house sold in the Netherlands from 2006 to 2016 (in euros).
More Information
E-Cigarettes
May 31, 2017
This chart shows sales electronic cigarettes dollar sales worldwide from 2008 to 2017 (in million U.S. dollars)
More Information
E-Cigarettes
May 31, 2017
This chart shows Electronic cigarette market share in the United States in 2016 (based on unit sales)
More Information
Guns
May 30, 2017
This chart shows the U.S. states in which children killed themselves with a gun or were mistakenly shot by another child from 2014...
More Information
Work & Health
May 30, 2017
This chart shows health status of prime-age men (ages 25 to 54) in the United States in 2016
More Information
Smart speaker use cases
May 29, 2017
This chart shows what smart speakers are used for by households owning such devices in the United States.
More Information
Migration
May 29, 2017
This chart shows the long-term international migration to the UK.
More Information
Holidays & Vacations
May 29, 2017
This chart shows the average vacation days Americans use per year since 1978
More Information
Memorial Day
May 29, 2017
This chart shows the share of U.S. adults that have a 'very favorable' opinion of their armed forces, by branch and age group.
More Information
Drugs & Health
May 29, 2017
This chart shows the prevalence of drug use worldwide in 2016 (in percent)
More Information
Kennedy at 100
May 29, 2017
This chart details the memorials in the U.S. to the 35th President John F. Kennedy.
More Information
European Comparison
May 24, 2017
This graphic shows the number of IKEA outlets in European countries, as of 2016 or later.
More Information
Internet
May 24, 2017
This chart shows a distribution of referral traffic sources, by article topic.
More Information
Digital Media Use
May 24, 2017
This chart shows share the of consumers willing to pay for digital newspapers and magazines in the UK in 2017, by age
More Information
Tech
May 24, 2017
This infographic shows the hours per day spent online via a mobile device, per user.
More Information
U.S. Politics
May 23, 2017
This chart shows the average share that approve/disapprove of the job President Trump is doing.
More Information
Q1 Roundup
May 23, 2017
This chart shows net income growth rate of U.S. tech companies from Q1 2016 to Q1 2017.
More Information
Consumer Electronics
May 23, 2017
Sales of consumer drones to dealers in the U.S. from 2013 to 2017 (in million U.S. dollars)
More Information
Virtual Shareholder Meetings
May 23, 2017
The Infographic shows the number of virtual annual general meetings in the U.S. for which Broadridge provided the service.
More Information
Manchester
May 23, 2017
This infographic shows the share of survey respondents that think terrorist attacks in Britain are likely.
More Information
Military Exports
May 22, 2017
This chart shows the value of U.S. arms exports in 2016, by country.
More Information
Finance & Credit
May 22, 2017
This chart shows U.S. household debt, housing and non-housing (in trillion of dollars)
More Information
Finance & Banking
May 22, 2017
This chart shows finance and banking jobs marked for relocation from the UK to the EU in connection with the Brexit
More Information
Cryptocurrencies
May 22, 2017
This chart shows the price development of gold and Bitcoin.
More Information
Tech
May 22, 2017
This infographic shows smartphone brand retention rates in the United States in 2017.
More Information
Jobs
May 19, 2017
This chart shows the most commonly cited issues employees have with their managers.
More Information
Apple Pay
May 19, 2017
This map shows countries/regions in which Apple Pay is available.
More Information
Populism
May 19, 2017
This chart shows popular votes in which populists & agendas were pitched against moderate candidates & causes
More Information
Most Valuable Brands
May 19, 2017
This chart shows the brand value of the 10 most valuable brands (in billion U.S. dollars) and the year-over-year percentage change
More Information
Rich List
May 18, 2017
This chart shows the total earnings of the highest-earning hedge fund managers in 2016.
More Information
Uber
May 18, 2017
This chart shows how the negative headlines surrounding Uber have impacted public perception of the ride-hailing company.
More Information
Google
May 18, 2017
This chart sums up key figures about Google's online offerings.
More Information
Refugee Crisis
May 18, 2017
This chart shows applicants for asylum aged 13 and under in 32 European countries from 2008 to 2016.
More Information
President Trump
May 18, 2017
This chart shows betting volume for the question "Will Donald Trump be impeached in 2017?".
More Information
Retail
May 18, 2017
This chart shows retail space per 1,000 people in selected developed and emerging markets.
More Information
Homebuyers
May 18, 2017
This chart displays the distribution of homebuyers in the Netherlands in Q1 2016 and Q1 2017, by age group.
More Information
Petrol
May 18, 2017
This chart displays the average price per liter of Euro-super 95 in different European countries.
More Information
Education & Work
May 18, 2017
This chart shows the share of 25- to 29-year-old employees in the U.S. with a bachelor's degree or more (in percent)
More Information
Virtual Reality
May 17, 2017
This chart illustrates the limited interest in virtual reality in the United States.
More Information
U.S. Politics
May 17, 2017
This chart shows the share of registered voters very/somewhat concerned about Trump scandals in October 2016.
More Information
United States
May 17, 2017
This chart shows the U.S. neighborhoods with the most new apartments built from 2010 to 2016.
More Information
Video game consoles
May 16, 2017
This chart shows how many U.S. consumers have heard of current-generation video game consoles.
More Information
Amazon
May 16, 2017
This chart ranks U.S. retail companies by their market capitalization on May 15, 2017.
More Information
Trump Administration
May 16, 2017
This chart shows the percentage of Americans supporting an independent investigation into Trump campaign ties with Russia.
More Information
Business
May 16, 2017
This chart shows the share of Western European companies which dismissed a CEO in 2016, by industry.
More Information
127
/
161
Contact
Get in touch with us. We are happy to help.
Do you still have questions?
Feel free to contact us anytime using our
contact form
or visit our
FAQ page
.
Your contact to the Infographics Newsroom
Felix Richter
Data Journalist
felix.richter@statista.com
+49 (40) 284 841 557