Skip to main content
Consumer Goods & FMCG
E-Commerce
Economy & Politics
Energy & Environment
Health, Pharma & Medtech
Internet
Media
Technology & Telecommunications
Transportation & Logistics
Travel, Tourism & Hospitality
View all industries
Global data volume growth
Global AI market size
Number of generative AI users worldwide
Global inflation rate
Retail e-commerce sales worldwide
Largest economies worldwide
Biggest social media platforms by users
Global EV market share by manufacturer
International tourist arrivals by world region
Global annual CO₂ emissions
Browse recent statistics
Artificial intelligence (AI) worldwide
TikTok
Nvidia
E-commerce worldwide
Global GDP
Instagram
Apparel market worldwide
Video gaming worldwide
Global renewable energy industry
Influencer marketing worldwide
Browse recent topics
Consumer Trends 2026
Artificial Intelligence: in-depth market analysis
E-commerce challenges
Global economy
TikTok
Luxury goods: in-depth market analysis
Electric vehicles: A global overview
Video gaming worldwide
Travel and tourism trends 2026
Battery recycling worldwide
Browse recent reports
Explore the tool
Explore Classic mode
Advertising & Media
eCommerce
Consumer
Finance
Global Indicators
Health
Industrial
Mobility
Technology
Explore Market Insights
eCommerce Insights
Research AI
Book a demo
All integrations
Developer docs
Explore Statista Connect
Research
Strategy & Consulting
Marketing
Media & PR
Explore AI assistants
Marketing
Research & Development
Strategy
Sales
Find the fact
Tell the story
Win the pitch
Understand the market
Develop your strategy
Academia
Agencies
Consultancies
Consumer goods
Finance
Tech
Research solutions
Strategy consulting
Communication services
Explore Statista+
Statista R
Statista Healthcare
About Statista
First steps & help center
Webinar & training hub
Success stories
Individuals & Small Teams
Businesses & Enterprises
Academia & Government
English
Deutsch
Daily Data
Global stories vividly visualized
International Tourism
Oct 1, 2026
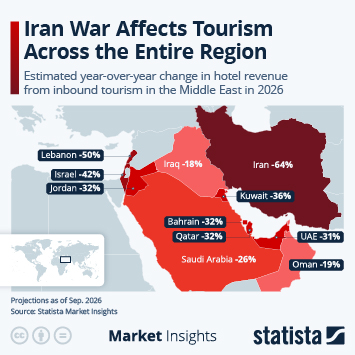
This chart shows the estimated change in hotel revenue from international tourists in the Middle East in 2026.
More Information
International Tourism
Oct 1, 2026
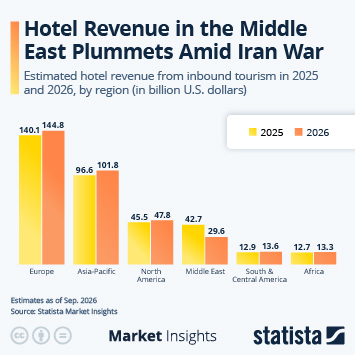
This chart shows estimated hotel revenue from inbound tourists in 2025 and 2027, by region.
More Information
Sponsored post by Booking.com
Oct 1, 2026
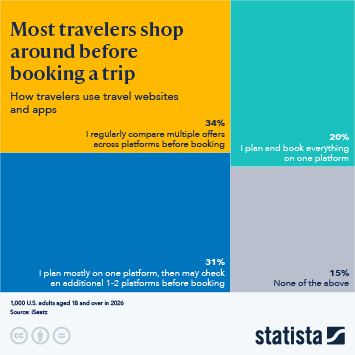
This infographic shows how travelers use multiple travel platforms while booking a trip.
More Information
Global Innovation Index
Sep 30, 2026
This chart shows 2026 ranking of the Global Innovation Index.
More Information
AI Patents
Sep 30, 2026
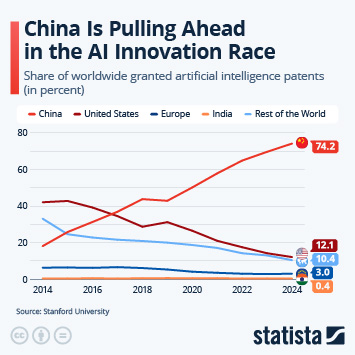
This chart shows the share of worldwide granted artificial intelligence patents by countries and regions.
More Information
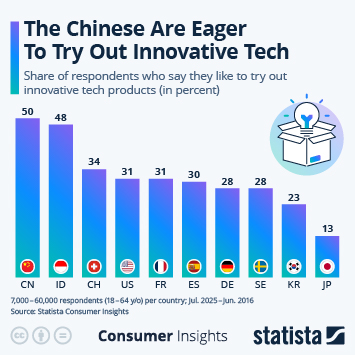
Innovative Tech
Sep 30, 2026
This chart shows the share of respondents who say they like to try out innovative tech products.
More Information
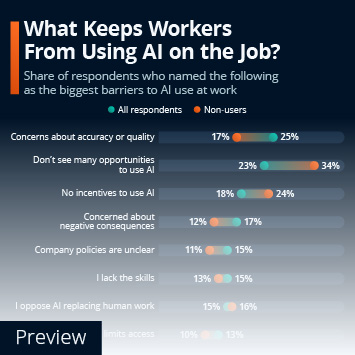
AI at Work
Sep 29, 2026
This chart shows the most cited barriers to AI use at work.
More Information
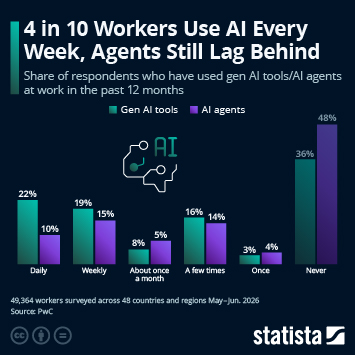
AI at Work
Sep 29, 2026
This chart shows how often workers use AI tools and AI agents at work.
More Information
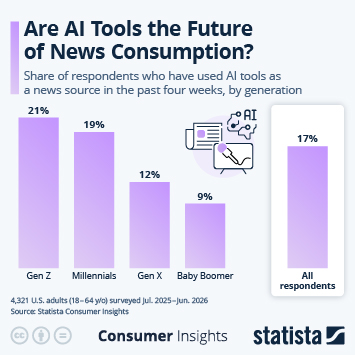
AI News Consumption
Sep 28, 2026
This chart shows how many people in the U.S. use AI tools to get news.
More Information
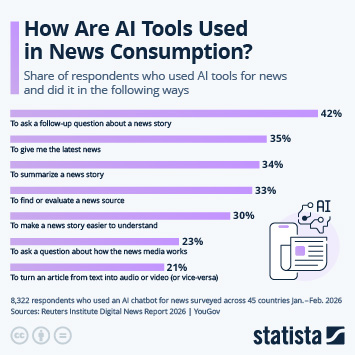
AI in News Consumption
Sep 28, 2026
This chart shows how respondents who used AI for news consumption did so.
More Information
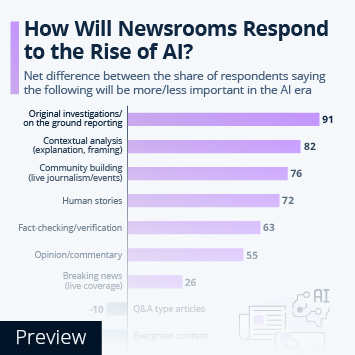
AI and Journalism
Sep 28, 2026
This chart shows how digital media leaders think the industry should react to the rise of AI.
More Information
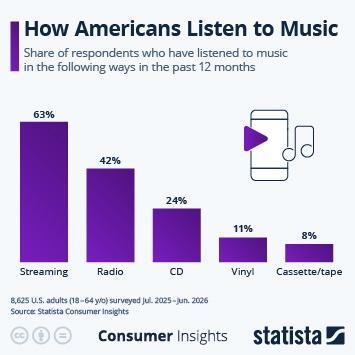
Music Consumption
Sep 24, 2026
This chart shows which formats Americans use to listen to music.
More Information
Music Industry
Sep 24, 2026
This chart shows CD and vinyl album sales in the United States since 1975.
More Information
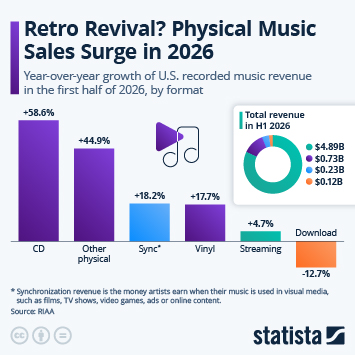
Music industry
Sep 24, 2026
This chart shows U.S. recorded music revenue growth in the first half of 2026.
More Information
Domestic robots
Sep 24, 2026
This chart shows how popular lawn-mowing and vacuum robots are in selected countries.
More Information
Industrial Robots
Sep 24, 2026
This chart shows the global operational stock of industrial robots.
More Information
Industrial Robots
Sep 24, 2026
This chart shows the countries with the highest number of newly installed industrial robots in 2025.
More Information
Sponsored post by Booking.com
Sep 24, 2026
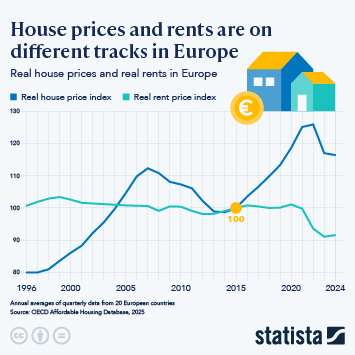
This infographic shows a comparison of house prices and rents in Europe from 1996 - 2024.
More Information
Economic Situation
Sep 23, 2026
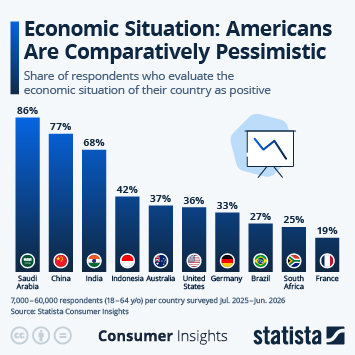
This chart shows the share of respondents who evaluate the economic situation of their country as positive.
More Information
OECD
Sep 23, 2026
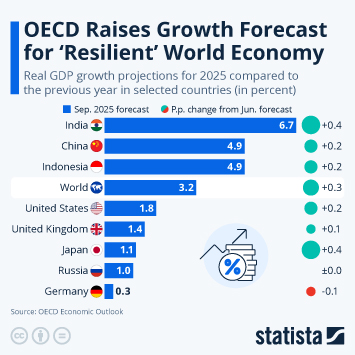
This chart shows the OECD's real GDP growth projections in 2026 compared to the previous year in selected countries.
More Information
The second Trump administration
Sep 23, 2026
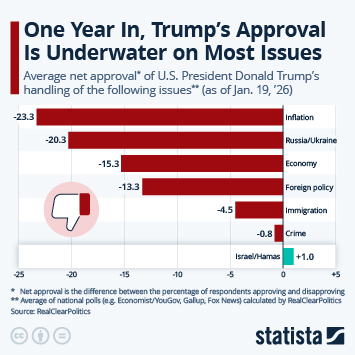
This chart shows Trump's net approval on selected key issues.
More Information
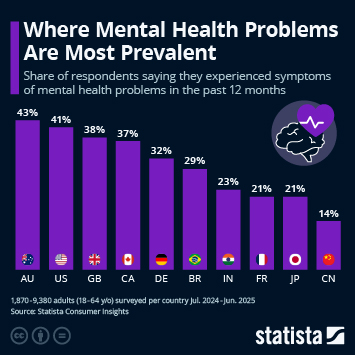
Mental Health
Sep 22, 2026
This chart shows where symptoms of mental health problems are most widespread.
More Information
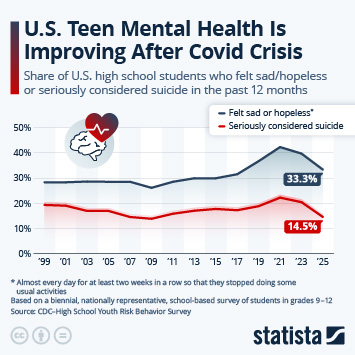
Mental Health
Sep 22, 2026
This chart shows how many high schools students in the U.S. showed signs of mental health problems between 1999 and 2025.
More Information
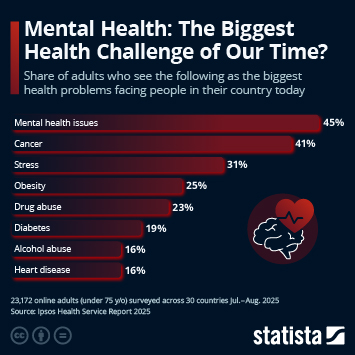
Health
Sep 22, 2026
This chart shows the results of a 30-country survey about the biggest health problems of our time.
More Information
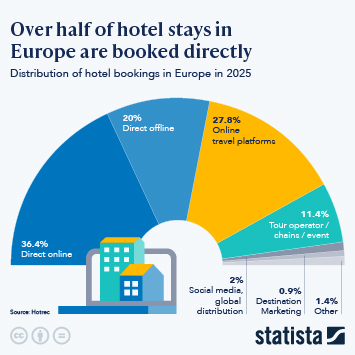
Sponsored Post by Booking.com
Sep 22, 2026
This infographic shows the share of hotel bookings in 2025 in Europe by booking method.
More Information
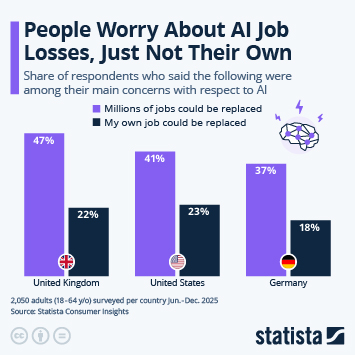
AI Concerns
Sep 21, 2026
This chart shows how many people in the UK, the U.S. and Germany said that job losses are one of their main concerns with respect to...
More Information
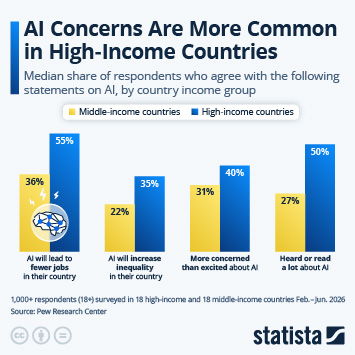
AI Concerns
Sep 21, 2026
This chart shows the median share of respondents who agree with the following statements on AI, by country income group.
More Information
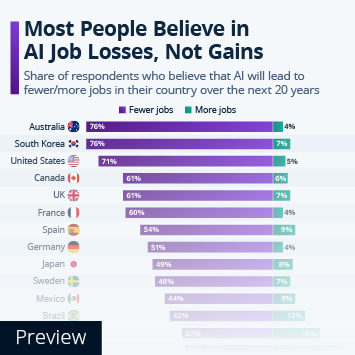
AI Impact on Jobs
Sep 21, 2026
This chart shows the share of respondents from selected countries who believe that AI will lead to fewer/more jobs in their country...
More Information
Global Gender Gap Report 2026
Sep 18, 2026
This chart shows the top scoring countries on the World Economic Forum's Global Gender Gap Index, by year.
More Information
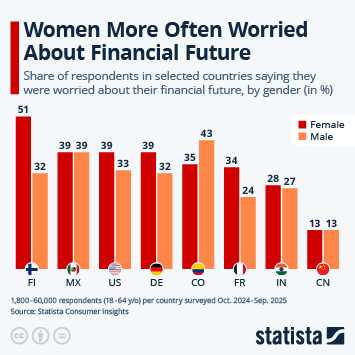
Gender Equality
Sep 18, 2026
This chart shows the share of respondents in selected countries saying they were worried about their financial future, by gender (in...
More Information
International Equal Pay Day
Sep 18, 2026
This chart shows average hourly wages for men and women in the United States in 2025, by education levels.
More Information
Gender Gap
Sep 18, 2026
This chart shows the share of the gender gap closed as of 2026, by subindex (100 percent=full parity).
More Information
Federal Funds Rate
Sep 17, 2026
This chart shows FOMC members' projections for the appropriate target level of the federal funds rate at the end of the specified year.
More Information
Monetary Policy
Sep 17, 2026
This chart shows the U.S. federal funds target rate since 2014.
More Information
Sponsored post by Booking.com
Sep 16, 2026
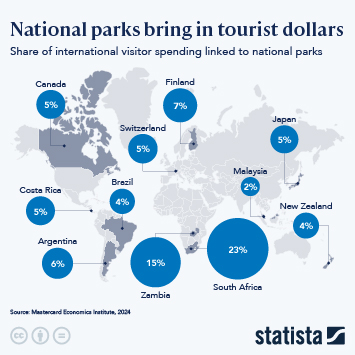
This infographic shows share of international visitor spending linked to national parks, by country.
More Information
Video Streaming
Sep 15, 2026
This chart shows the share of U.S. adults who used each video streaming service in the past 12 months.
More Information
Emmy Awards
Sep 15, 2026
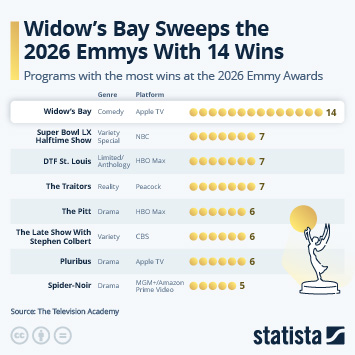
This chart shows which networks/platforms won the most prizes at the 78th Emmy Awards in September 2026.
More Information
Emmy Awards
Sep 15, 2026
This chart shows which programs won the most awards at the 2026 Emmy Awards.
More Information
Accommodation
Sep 15, 2026
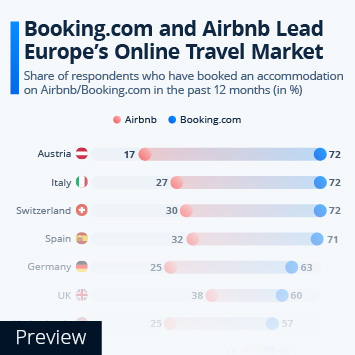
This chart shows the most popular online accommodation platforms in selected European markets.
More Information
Short-term rental market
Sep 15, 2026
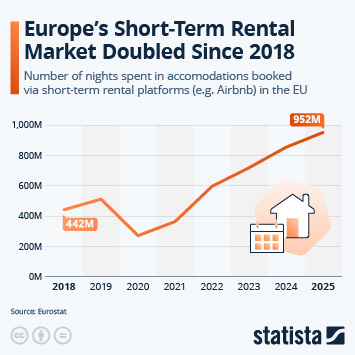
This chart shows the number of nights spent in accomodations booked via short-term rental platforms (e.g. Airbnb) in the EU.
More Information
Democracy Index
Sep 14, 2026
This chart shows countries around the world as rated on the democracy index.
More Information
U.S. Politics
Sep 14, 2026
This chart shows the share of respondents in selected countries rating their political stance between left and right as follows (in...
More Information
Democracy
Sep 14, 2026
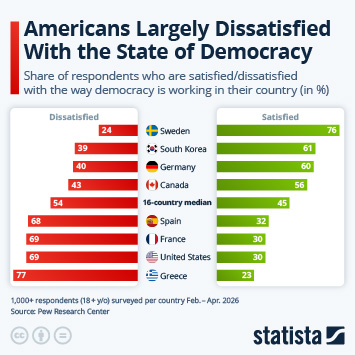
This chart shows how satisfied respondents in selected high-income countries are with the state of democracy in their country.
More Information
25 Years after 9/11
Sep 11, 2026
This chart shows the share of U.S. respondents saying Islam is more likely than other religions to encourage violence.
More Information
Terror
Sep 11, 2026
This chart shows the share of respondents who think that terrorism is one of the biggest challenges in their country.
More Information
25 years after 9/11
Sep 11, 2026
This chart shows the costliest disasters worldwide by insured losses.
More Information
Smartphones
Sep 10, 2026
This chart ranks smartphone brands in the U.S. by brand loyalty.
More Information
Apple iPhone
Sep 10, 2026
This chart provides an overview of the prices of Apple's iPhone line-up.
More Information
Space Budgets
Sep 9, 2026
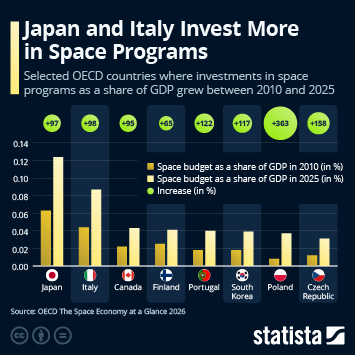
This chart shows selected OECD countries where investments in space programs as a share of GDP grew between 2010 and 2025.
More Information
Science Fiction
Sep 9, 2026
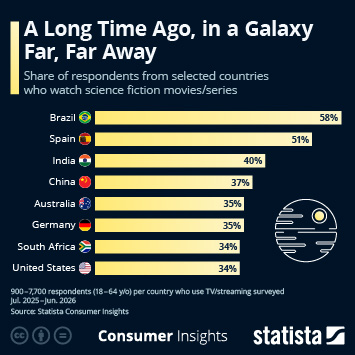
This chart shows the share of respondents from selected countries who watch science fiction movies/series.
More Information
Space Junk
Sep 9, 2026
This chart shows artificial objects in Earth's orbit by year of launch/separation.
More Information
Satellites
Sep 9, 2026
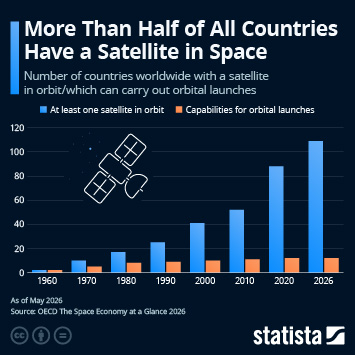
This chart shows the number of countries worldwide with a satellite in orbit/which can carry out orbital launches.
More Information
PISA 2025
Sep 8, 2026
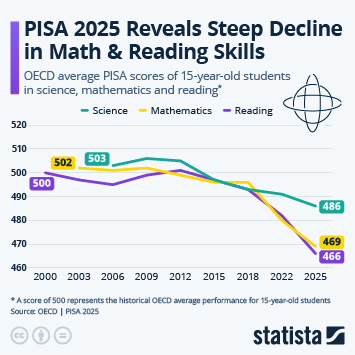
This chart shows the trend in OECD average scored in science, mathematics and reading according to PISA studies.
More Information
PISA 2025
Sep 8, 2026
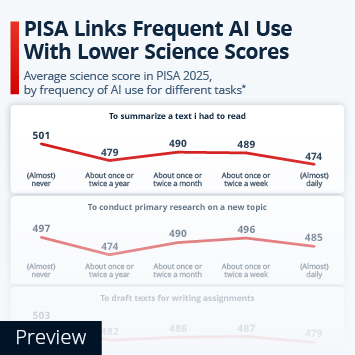
This chart shows the effect of AI use on science scores of 15-year-old students according to results from PISA 2025.
More Information
AI Use
Sep 8, 2026
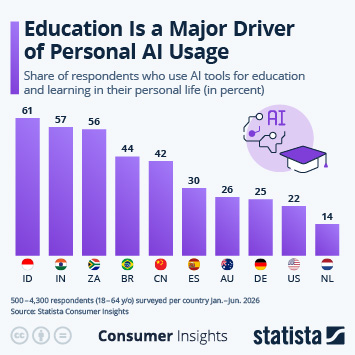
This chart shows how many consumers in selected countries use AI tools for education and learning.
More Information
Sponsored post by Booking.com
Sep 8, 2026
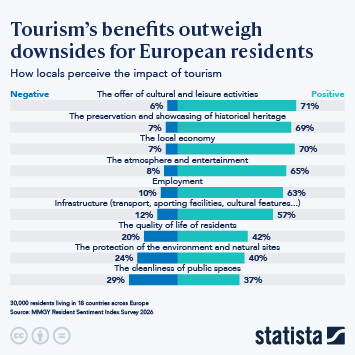
This infographic shows the share of European residents and how they view the impact of tourism.
More Information
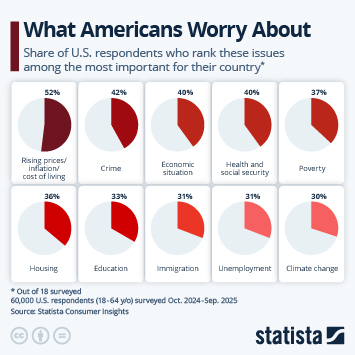
Issues
Sep 7, 2026
This chart shows the share of U.S. respondents who rank these issues among the most important for their country.
More Information
Labor Force Participation
Sep 7, 2026
This chart shows the labor-force participation rate for women between the ages of 15 and 64 in selected countries.
More Information
Labor Unions
Sep 7, 2026
This chart shows trade union membership as a percentage of total employees.
More Information
Unions
Sep 7, 2026
This chart shows U.S. respondents' attitudes towards unions.
More Information
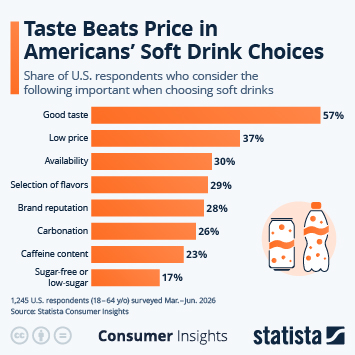
Soft Drinks
Sep 4, 2026
This chart ranks purchase criteria for soft drinks in the United States.
More Information
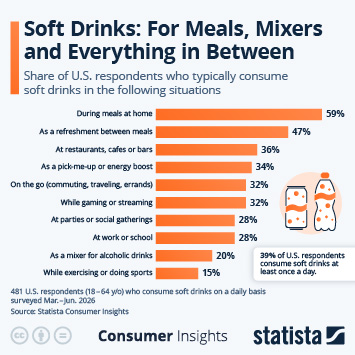
Soft Drinks
Sep 4, 2026
This chart shows when Americans typically consume soft drinks.
More Information
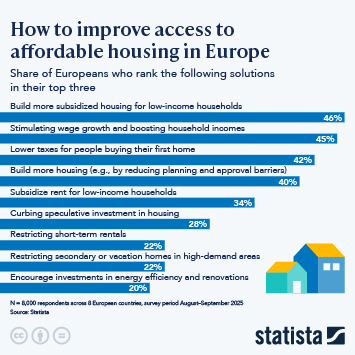
Sponsored post by Booking.com
Sep 4, 2026
This infographic shows the leading solutions to improve affordable housing according to a European survey.
More Information
Beverage Market
Sep 4, 2026
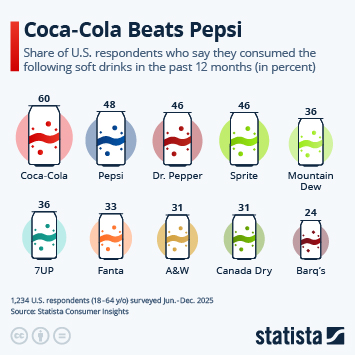
This chart shows the share of U.S. respondents who say they consumed the following soft drinks in the past 12 months.
More Information
AI
Sep 3, 2026
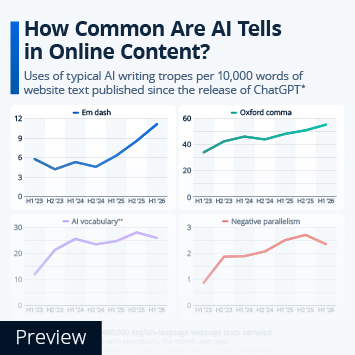
This chart shows how often typical AI tells like the em dash or certain vocabulary shows up in online content.
More Information
AI
Sep 3, 2026
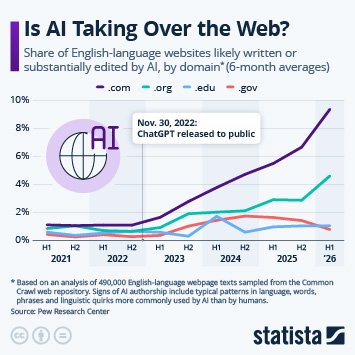
This chart shows the share of English-language websites likely written or edited by AI.
More Information
AI & News
Sep 3, 2026
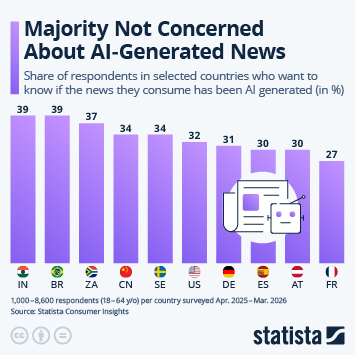
This chart shows the share of respondents in selected countries who want to know if the news they consume has been AI generated.
More Information
Redistricting
Sep 2, 2026
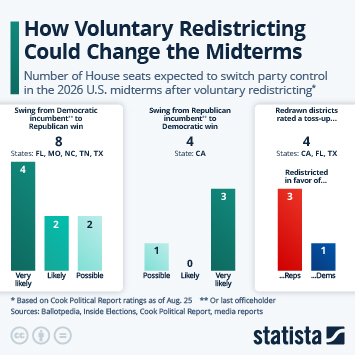
This chart shows the number of House seats expected to switch party control in the 2026 U.S. midterms after voluntary redistricting.
More Information
News
Sep 2, 2026
This chart shows the share of respondents who agree with the following statements on news.
More Information
Midterms
Sep 2, 2026
This chart shows the net seat loss/gain by the president's party in the U.S. midterm elections since 1962.
More Information
Midterm Elections
Sep 2, 2026
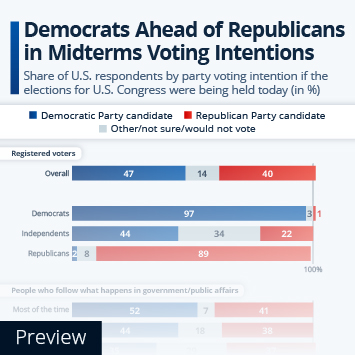
This infographic shows the share of U.S. respondents by party voting intention in the 2026 midterm elections.
More Information
Consumer Electronics
Sep 1, 2026
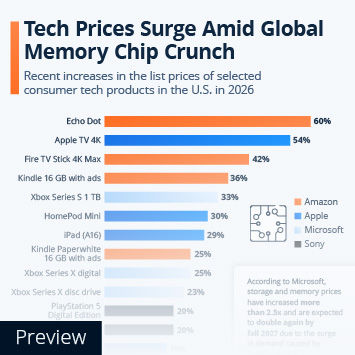
This chart provides a snapshot of recent consumer electronics price increases in the United States.
More Information
Semiconductor market
Sep 1, 2026
This chart shows global memory chip revenue from 2019 to 2027.
More Information
Consumer Technology
Sep 1, 2026
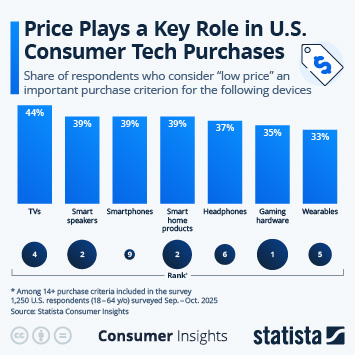
This chart shows the share of U.S. respondents who consider "low price" an important puchase factor for the following devices.
More Information
Shein IPO
Aug 31, 2026
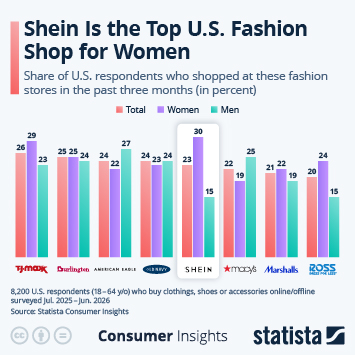
This chart shows the share of U.S. respondents who shopped at these fashion stores in the past three months.
More Information
Shein IPO
Aug 31, 2026
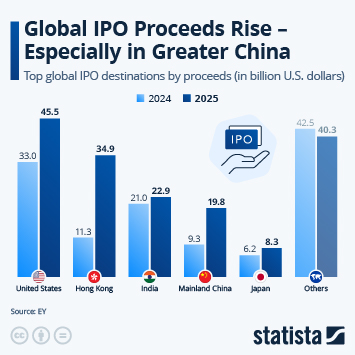
This chart shows top global IPO destinations by proceeds.
More Information
Shein
Aug 31, 2026
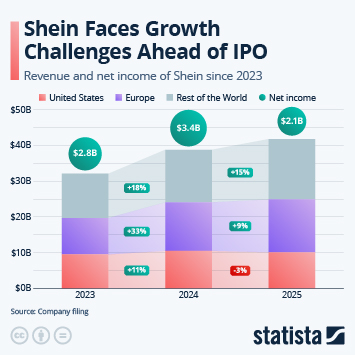
This chart shows Shein's net revenue and net income from 2023 to 2025.
More Information
Shein IPO
Aug 31, 2026
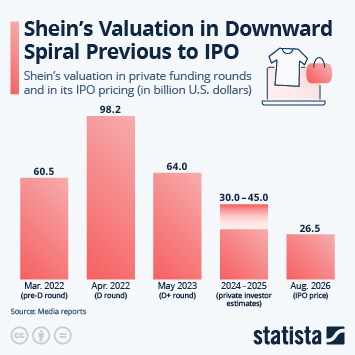
This chart shows Shein's valuation in private funding rounds and in its IPO pricing (in billion U.S. dollars).
More Information
U.S. Festivals
Aug 28, 2026
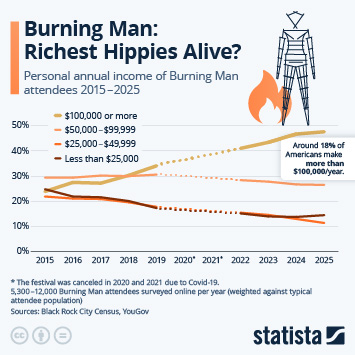
This chart shows the personal annual income of Burning Man attendees.
More Information
Live Music
Aug 28, 2026
This chart shows the share of respondents who have booked tickets to music events/concerts/festivals in the past 12 months.
More Information
Live Events
Aug 28, 2026
This chart shows the share of U.S. respondents who purchased tickets online from the following providers.
More Information
Nvidia
Aug 27, 2026
This chart shows Nvidia's quarterly revenue since Q1 2021.
More Information
AI Tools
Aug 27, 2026
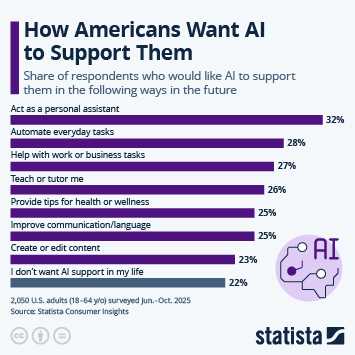
This chart shows how Americans want AI tools to help them in the future.
More Information
AI Usage
Aug 27, 2026
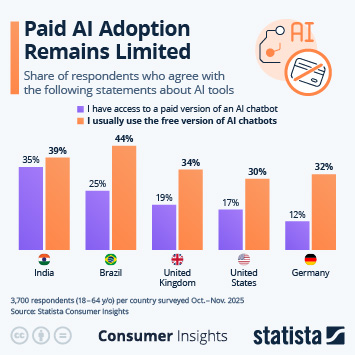
This chart shows how many consumers use free versus paid AI tools.
More Information
Artificial Intelligence
Aug 27, 2026
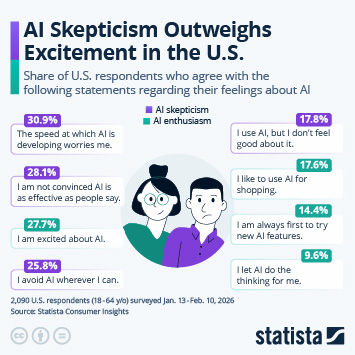
This chart shows how Americans feel about AI in 2026.
More Information
Unemployment
Aug 26, 2026
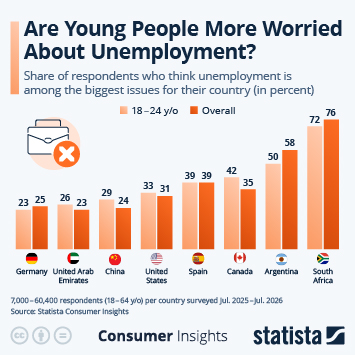
This chart shows the share of respondents who think unemployment is among the biggest issues for their country.
More Information
Unemployment
Aug 26, 2026
This chart shows the monthly unemployment rates in selected OECD countries.
More Information
Youth Unemployment
Aug 26, 2026
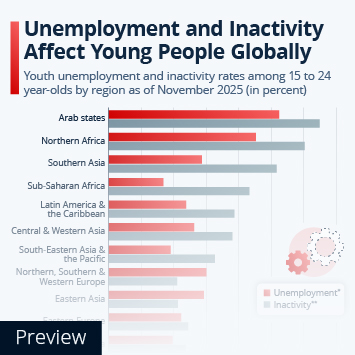
This chart shows youth unemployment and inactivity rates among 15 to 24 year-olds by region.
More Information
Youth Unemployment
Aug 26, 2026
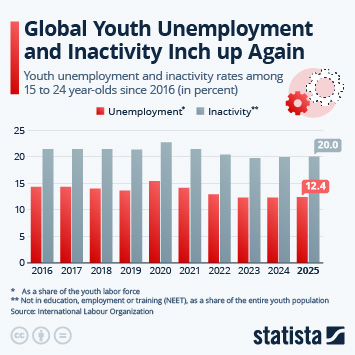
This chart shows youth unemployment and inactivity rates among 15 to 24 year-olds since 2016.
More Information
Gaming
Aug 25, 2026
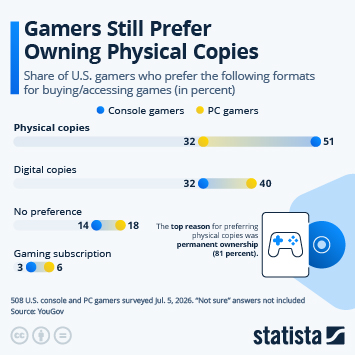
This chart shows the share of U.S. gamers who prefer the following formats for buying/accessing games.
More Information
3
/
161
Contact
Get in touch with us. We are happy to help.
Do you still have questions?
Feel free to contact us anytime using our
contact form
or visit our
FAQ page
.
Your contact to the Infographics Newsroom
Felix Richter
Data Journalist
felix.richter@statista.com
+49 (40) 284 841 557