Skip to main content
Consumer Goods & FMCG
E-Commerce
Economy & Politics
Energy & Environment
Health, Pharma & Medtech
Internet
Media
Technology & Telecommunications
Transportation & Logistics
Travel, Tourism & Hospitality
View all industries
Global data volume growth
Global AI market size
Number of generative AI users worldwide
Global inflation rate
Retail e-commerce sales worldwide
Largest economies worldwide
Biggest social media platforms by users
Global EV market share by manufacturer
International tourist arrivals by world region
Global annual CO₂ emissions
Browse recent statistics
Artificial intelligence (AI) worldwide
TikTok
Nvidia
E-commerce worldwide
Global GDP
Instagram
Apparel market worldwide
Video gaming worldwide
Global renewable energy industry
Influencer marketing worldwide
Browse recent topics
Consumer Trends 2026
Artificial Intelligence: in-depth market analysis
E-commerce challenges
Global economy
TikTok
Luxury goods: in-depth market analysis
Electric vehicles: A global overview
Video gaming worldwide
Travel and tourism trends 2026
Battery recycling worldwide
Browse recent reports
Explore the tool
Explore Classic mode
Advertising & Media
eCommerce
Consumer
Finance
Global Indicators
Health
Industrial
Mobility
Technology
Explore Market Insights
eCommerce Insights
Research AI
Book a demo
All integrations
Developer docs
Explore Statista Connect
Research
Strategy & Consulting
Marketing
Media & PR
Explore AI assistants
Marketing
Research & Development
Strategy
Sales
Find the fact
Tell the story
Win the pitch
Understand the market
Develop your strategy
Academia
Agencies
Consultancies
Consumer goods
Finance
Tech
Research solutions
Strategy consulting
Communication services
Explore Statista+
Statista R
Statista Healthcare
About Statista
First steps & help center
Webinar & training hub
Success stories
Individuals & Small Teams
Businesses & Enterprises
Academia & Government
English
Deutsch
Daily Data
Global stories vividly visualized
Uber
Nov 6, 2026
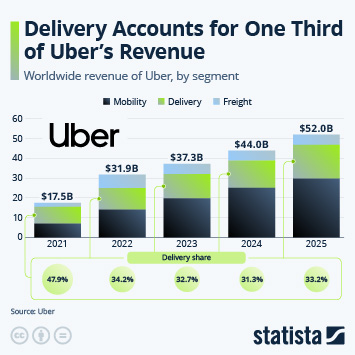
This chart shows the worldwide revenue of Uber, by segment.
More Information
Food Delivery
Nov 6, 2026
This chart shows America's favorite food delivery options.
More Information
Video game consoles
Nov 5, 2026
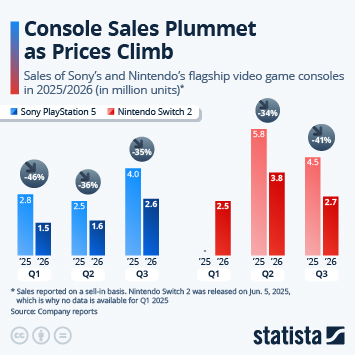
This chart shows the latest trend in Sony's and Nintendo's video game console sales.
More Information
Entertainment
Nov 5, 2026
This chart shows share of U.S. respondents who regularly play video games, by platform.
More Information
Video Game Consoles
Nov 5, 2026
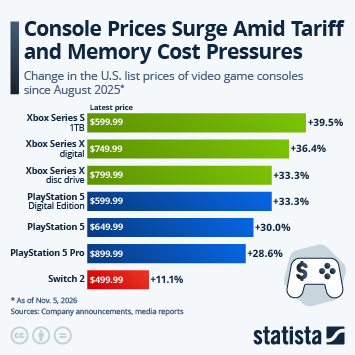
This chart shows the latest price increases of game consoles in the United States.
More Information
Midterms
Nov 5, 2026
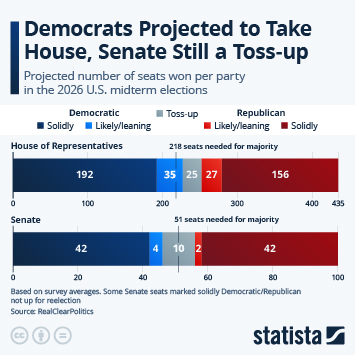
This chart shows the projected number of seats won per party in the 2026 U.S. midterm elections.
More Information
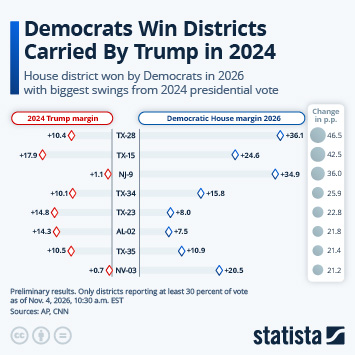
Midterms 2026
Nov 4, 2026
This chart shows the House district won by Democrats in 2026 with biggest swings from 2024 presidential vote.
More Information
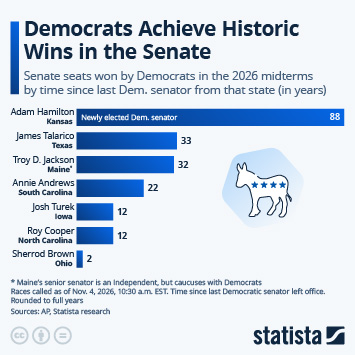
Midterms 2026
Nov 4, 2026
This chart shows the Senate seats won by Democrats in the 2026 midterms by time since last Democratic senator from that state.
More Information
Politics
Nov 3, 2026
This chart shows the share of respondents in selected countries who said that politics was among their personal interests.
More Information
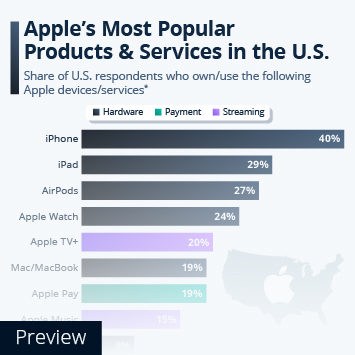
Apple
Nov 3, 2026
This chart shows how many Americans use different Apple devices and services.
More Information
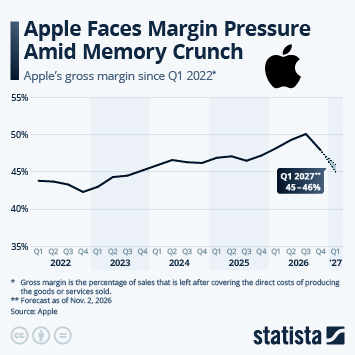
Apple
Nov 3, 2026
This chart shows Apple's quarterly gross margin.
More Information
Apple
Nov 3, 2026
This chart shows Apple's revenue by operating segment since fiscal year 2001.
More Information
Natural Disasters
Nov 2, 2026
This chart shows the cost of natural disaster losses worldwide from 2000 to 2026.
More Information
Insurances
Nov 2, 2026
This chart shows the share of U.S. respondents who have the following insurance policies.
More Information
Insurance
Nov 2, 2026
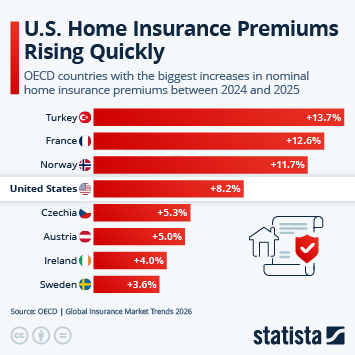
This chart shows OECD countries with the biggest increases in nominal home insurance premiums between 2024 and 2025.
More Information
Anthropic
Oct 30, 2026
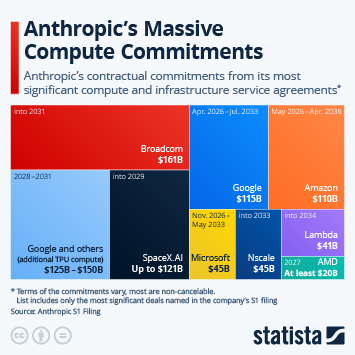
This chart shows Anthropic's compute and infrastructure commitments as laid out in the company's S-1 filing.
More Information
Cloud Infrastructure
Oct 30, 2026
This chart shows the growth of global cloud infrastructure services since 2017.
More Information
AI Usage
Oct 30, 2026
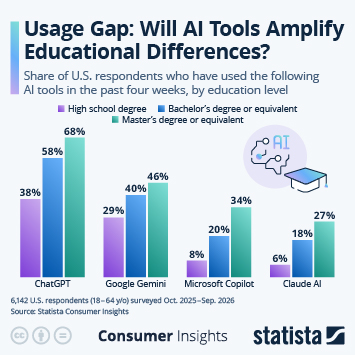
This chart shows AI tool adoption in the U.S. by education level.
More Information
Monetary Policy
Oct 29, 2026
This chart shows the U.S. federal funds target rate since 2014.
More Information
Global Inflation
Oct 29, 2026
This chart shows the share of respondents who believe that inflation is one of the most important problems in their country.
More Information
States' Finances
Oct 29, 2026
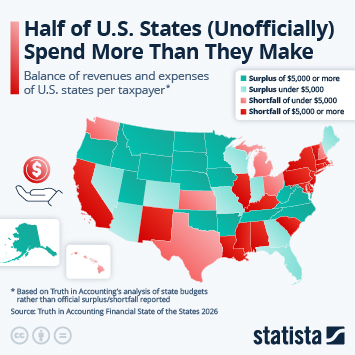
This chart shows the balance of revenues and expenses of U.S. states per taxpayer.
More Information
Halloween
Oct 28, 2026
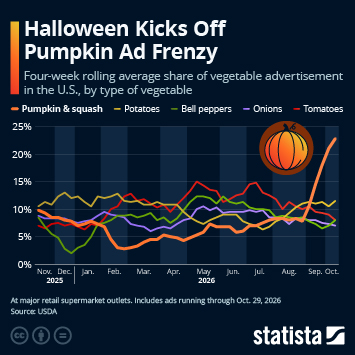
This chart shows the four-week rolling average share of vegetable advertisement in the U.S., by type of vegetable.
More Information
Halloween
Oct 28, 2026
This chart shows the share of respondents who watch or stream "horror" movies/series/videos on TV or online.
More Information
Halloween
Oct 28, 2026
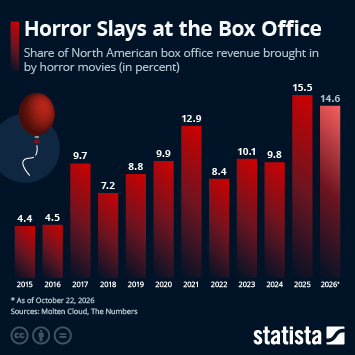
This chart shows the share of North American box office revenue brought in by horror movies.
More Information
Transportation & Logistics
Oct 27, 2026
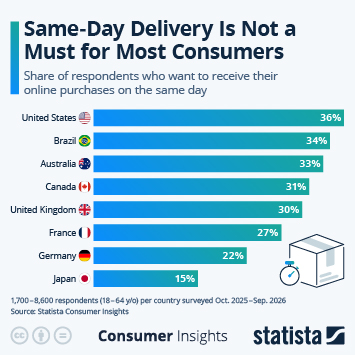
This chart shows the share of consumers in selected countries who want to receive their online orders on the same day.
More Information
Transportation & Logistics
Oct 27, 2026
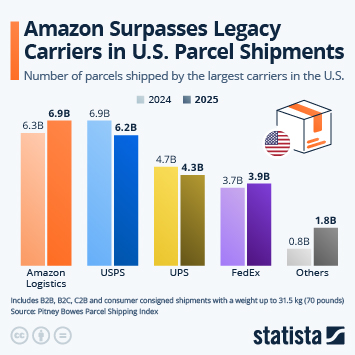
This chart shows how many parcels the largest carriers in the U.S. delivered in 2024 and 2025.
More Information
Transportation & Logistics
Oct 27, 2026
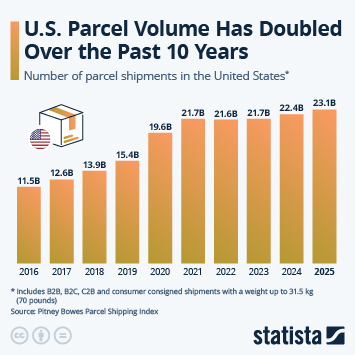
This chart shows how many parcels are shipped in the United States each year.
More Information
Midterms
Oct 26, 2026
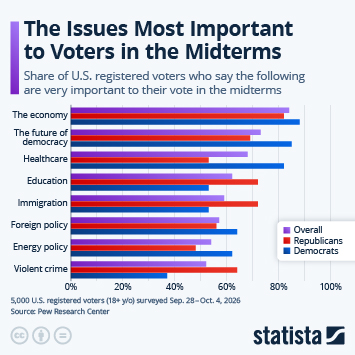
This chart shows the share of U.S. registered voters who say the following are very important to their vote in the midterms.
More Information
Politics
Oct 26, 2026
This chart shows the share of respondents who have expressed their opinion about politics online in the past month, by country.
More Information
Sponsored post by Booking.com
Oct 23, 2026
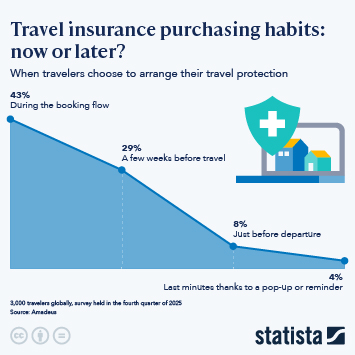
This infographic shows at what time in the booking flow travelers obtain their travel insurance.
More Information
2
/
161
Contact
Get in touch with us. We are happy to help.
Do you still have questions?
Feel free to contact us anytime using our
contact form
or visit our
FAQ page
.
Your contact to the Infographics Newsroom
Felix Richter
Data Journalist
felix.richter@statista.com
+49 (40) 284 841 557