Skip to main content
Consumer Goods & FMCG
E-Commerce
Economy & Politics
Energy & Environment
Health, Pharma & Medtech
Internet
Media
Technology & Telecommunications
Transportation & Logistics
Travel, Tourism & Hospitality
View all industries
Global data volume growth
Global AI market size
Number of generative AI users worldwide
Global inflation rate
Retail e-commerce sales worldwide
Largest economies worldwide
Biggest social media platforms by users
Global EV market share by manufacturer
International tourist arrivals by world region
Global annual CO₂ emissions
Browse recent statistics
Artificial intelligence (AI) worldwide
TikTok
Nvidia
E-commerce worldwide
Global GDP
Instagram
Apparel market worldwide
Video gaming worldwide
Global renewable energy industry
Influencer marketing worldwide
Browse recent topics
Consumer Trends 2026
Artificial Intelligence: in-depth market analysis
E-commerce challenges
Global economy
TikTok
Luxury goods: in-depth market analysis
Electric vehicles: A global overview
Video gaming worldwide
Travel and tourism trends 2026
Battery recycling worldwide
Browse recent reports
Explore the tool
Explore Classic mode
Advertising & Media
eCommerce
Consumer
Finance
Global Indicators
Health
Industrial
Mobility
Technology
Explore Market Insights
eCommerce Insights
Research AI
Book a demo
All integrations
Developer docs
Explore Statista Connect
Research
Strategy & Consulting
Marketing
Media & PR
Explore AI assistants
Marketing
Research & Development
Strategy
Sales
Find the fact
Tell the story
Win the pitch
Understand the market
Develop your strategy
Academia
Agencies
Consultancies
Consumer goods
Finance
Tech
Research solutions
Strategy consulting
Communication services
Explore Statista+
Statista R
Statista Healthcare
About Statista
First steps & help center
Webinar & training hub
Success stories
Individuals & Small Teams
Businesses & Enterprises
Academia & Government
English
Deutsch
Daily Data
Infographics on the topic "statista trend"
Fossil fuels
Feb 16, 2021
This chart shows the total annual change in power generation in India, by fuel type (in terawatt-hours).
More Information
Covid-19 Outbreak
Feb 15, 2021
This chart shows the number of people hospitalized with Covid-19 in the United States.
More Information
Covid-19
Feb 15, 2021
This chart shows the actual and projected number of UK adults to have received the first dose of a Covid-19 vaccination.
More Information
Hate Crime
Feb 11, 2021
This chart shows the number of antisemitic incidents reported in the United Kingdom from 2008 to 2020.
More Information
Social Media
Feb 10, 2021
This chart shows quarterly year-over-year growth in Twitter's average monetizable daily active usage (mDAU) in 2019 and 2020.
More Information
Covid Crisis
Feb 4, 2021
This chart shows new car registrations in the United Kingdom In January from 2011 to 2021.
More Information
Sea Shanty Boom
Feb 4, 2021
This chart shows worldwide search interest for the term "sea shanty" on Google Search.
More Information
Renewable energy
Feb 2, 2021
This chart shows the amount of net worth generated from each renewable energy company (in billion U.S. dollars).
More Information
Railway Accidents
Jan 28, 2021
This chart shows the total number of passenger fatalities in railway accidents in the EU-27 by year.
More Information
Private Prisons in the United States
Jan 27, 2021
This chart shows the trend in the U.S. private prison population.
More Information
Corporate Debt
Jan 26, 2021
This chart shows the corporate debt level by country in Q2 2019 and Q2 2020.
More Information
Stock market
Jan 25, 2021
This chart shows the percent average initial return after SPAC IPOs in the U.S., 2003-2020.
More Information
Foreign Direct Investment
Jan 25, 2021
This chart shows the change in foreign direct investment inflow between 2019 and 2020 in selected regions and countries.
More Information
North Korea
Jan 22, 2021
This chart shows the number of North Korean defectors entering South Korea.
More Information
Population
Jan 5, 2021
This chart shows annual percent population growth in Japan and South Korea (2003-2020).
More Information
Politics
Jan 5, 2021
This chart shows the number of seats filled in the U.S. House and Senate by religion in 2021.
More Information
Remote work
Dec 16, 2020
This chart shows the percentage of U.S. work teams/departments that plan to work remotely in five years, compared to pre-pandemic.
More Information
Climate change
Dec 11, 2020
This chart shows the carbon offsets purchased by select companies from 2017-2019 (in thousand metric tons of carbon dioxide equivalent).
More Information
5G
Dec 10, 2020
This chart shows the projected 5G market penetration in selected countries by 2025 (as of December 2020).
More Information
Covid-19 Pandemic
Dec 10, 2020
This chart shows ICU occupancy rates at or above 100% in U.S. hospital service areas with high populations*
More Information
Pollution
Dec 9, 2020
This chart shows the number of countries in which plastic waste was found and pieces of waste recorded in 2020.
More Information
Afghanistan
Dec 8, 2020
This chart shows the estimated number of Afghan civilians killed in airstrikes by the U.S. and its allies.
More Information
International Trade
Dec 7, 2020
This chart shows the monthly U.S. trade deficit in goods and services (seasonally adjusted).
More Information
Markets
Dec 2, 2020
This chart shows the number of S&P 500 stocks contributing to market gains in 2020, by month.
More Information
Firearms
Nov 18, 2020
This chart shows the percentage of Americans who feel laws covering the sale of firearms should be made more strict.
More Information
Diseases
Nov 13, 2020
This chart shows the number of reported measles cases across the world for each year.
More Information
COVID-19 Vaccine
Nov 10, 2020
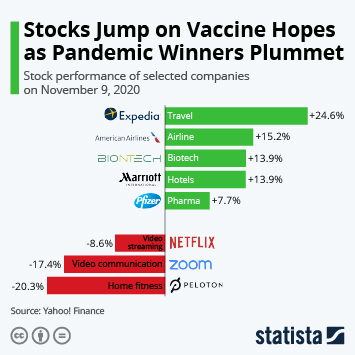
This chart shows the stock performance of selected companies on November 9, 2020 after Pfizer and BioNTech had announced progress in...
More Information
Inequality
Nov 6, 2020
This chart shows the percent growth in U.S. productivity and hourly compensation, 1950-2018.
More Information
Immigration
Nov 6, 2020
This chart shows the percentage of apprehensions at the U.S. southwest border, by year and type.
More Information
U.S. Presidential Elections
Nov 2, 2020
This chart shows how the S&P 500 performed in the days following U.S. presidential elections since 2000.
More Information
iPhone
Oct 30, 2020
This chart shows iPhone revenue as a percentage of Apple's total revenue since 2007.
More Information
Tourism
Oct 30, 2020
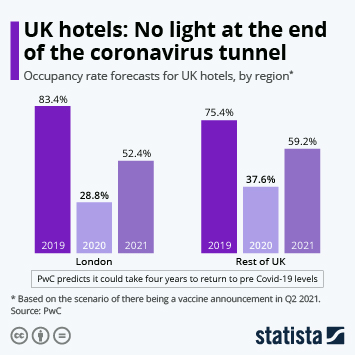
This chart shows UK hotel occupancy forecasts from 2019 to 2021.
More Information
Energy
Oct 20, 2020
This chart shows the percentage of U.S. electricity made from natural gas and coal for each year.
More Information
Unemployment
Oct 8, 2020
This chart shows the number of new eating and drinking jobs created in the U.S. relative to the previous month in 2020.
More Information
Nobel Prize
Oct 8, 2020
This chart shows Nobel Prizes awarded in the sciences since 1969 by country and share of immigrant researchers.
More Information
Teacher wages
Sep 28, 2020
This chart shows the percent difference in weekly wages for K-12 public school teachers compared to nonteaching, college-educated peers.
More Information
2020 Election
Sep 23, 2020
This chart shows the percentage of U.S. voters who are very closely following national politics, by presidential election year.
More Information
Clean energy
Sep 23, 2020
This chart shows the projected percent composition of passenger vehicles in China over the next two decades.
More Information
Climate change
Sep 21, 2020
This chart shows the amount of greenhouse gases produced by China and the U.S./Europe (in billion tons).
More Information
Covid-19 outbreak
Sep 16, 2020
This chart shows the share of the public saying the U.S. has done a bad/good job dealing with coronavirus.
More Information
United States
Sep 16, 2020
This chart shows the share of the public with a favorable view of the United States.
More Information
Global economy
Sep 14, 2020
This chart shows the percent growth from the previous month in GDP for 2020 for the U.K. and Norway.
More Information
Stock Market
Sep 1, 2020
This chart shows the change in U.S. stock market indices in August 2020.
More Information
Covid-19 Pandemic
Aug 24, 2020
This chart shows estimated views of health content from official/misinformation websites on Facebook in 2020.
More Information
Health
Aug 20, 2020
This chart shows deaths caused by melanoma skin cancer in the UK per 100,000 people in 1973 and 2017.
More Information
Smartphones
Aug 7, 2020
This chart shows the percent change year-over-year in smartphone shipments for each company.
More Information
Video Games
Aug 6, 2020
This chart shows total video game industry sales in the United States in March, April, May and June 2018-2020.
More Information
Household Consumption
Aug 5, 2020
This chart shows the year-over-year change in Japanese household consumption in households of two or more people, trend and inflation...
More Information
Homicide
Aug 4, 2020
This chart shows the number of homicides in selected U.S. cities in 2019 and 2020.
More Information
Best Employers
Jul 29, 2020
This chart shows the top 10 employers as rated by U.S. employees in 2020 (grading scale 0-100).
More Information
Energy consumption
Jul 22, 2020
This chart shows the search volume indices for the following electronics in 2019 and 2020.
More Information
IBM
Jul 21, 2020
This chart shows the percent change from the previous year in IBM's quarterly revenue.
More Information
Retail
Jul 17, 2020
This chart shows the percent change from the previous month in U.S. retail sales figures for 2020.
More Information
Banking
Jul 16, 2020
This chart shows loan-loss provisions among major U.S. banks over the last three quarters (in million U.S. dollars).
More Information
E-Commerce
Jul 8, 2020
This chart shows the value of e-commerce consumer expenditure in Japan in 2020, by category (billion U.S. dollars).
More Information
COVID-19 Outbreak
Jun 24, 2020
This chart shows the percentage change in spending by all consumers compared to the same period in 2019.
More Information
Phone Usage
Jun 22, 2020
Average mobile data traffic per smartphone in selected countries/regions for 2019-2021 (in GB/month).
More Information
Protective Masks
Jun 19, 2020
This chart shows the percentage of respondents who wear a face mask outside in response to the COVID-19 pandemic.
More Information
Unemployment in the United States
Jun 8, 2020
This chart shows the seasonally adjusted unemployment rate in the United States.
More Information
Racial Inequality
Jun 4, 2020
This chart shows the types of force used by Minneapolis police and percent share based on ethnicity between 2015-2020.
More Information
LATAM
Jun 2, 2020
This chart shows the daily number of reported COVID-19 deaths for each country in the month of May, 2020.
More Information
COVID-19 Pandemic
May 27, 2020
This chart shows daily reported COVID-19 cases by WHO region (Mar 01-May 25, 2020).
More Information
COVID-19 Outbreak
May 26, 2020
COVID-19 deaths in long-term care facilities as a share of total COVID-19 deaths.
More Information
Earnings
May 19, 2020
This chart shows some highlights from Q1 FY21 earnings report for Walmart.
More Information
Remote Working
May 15, 2020
This chart shows U.S. attitudes towards remote working on an individual and industry level during the COVID-19 crisis.
More Information
Smartphone Market
May 13, 2020
This chart shows worldwide quarterly smartphone shipments.
More Information
Remote Working
Apr 30, 2020
This chart shows the top reasons for remote working in 2019, as cited by U.S. remote workers.
More Information
COVID-19 Outbreak
Apr 7, 2020
This chart shows the African American share of state/city populations and COVID-19 deaths (as of Apr 06, 2020).
More Information
COVID-19 Outbreak
Apr 6, 2020
This chart shows the number of new daily Covid-19 infections in Germany.
More Information
Coronavirus
Mar 31, 2020
This chart shows the change in online interest in selected products over the past 30 days (as of March 31).
More Information
COVID-19 Outbreak
Mar 30, 2020
This chart shows the number of departing flights tracked at selected airports.
More Information
COVID-19 Outbreak
Mar 26, 2020
This chart shows the year-over-year change in diners at restaurants on the OpenTable network.
More Information
COVID-19
Mar 26, 2020
This chart shows the net favourability of selected UK politicians in March 2020.
More Information
COVID-19 Outbreak
Mar 23, 2020
This chart shows the percentage of young people aged 15-29 living with their parents in 2014.
More Information
COVID-19 Pandemic
Mar 19, 2020
Hospitalization, ICU admission and fatality rates for reported U.S. COVID-19 cases by age group.
More Information
Obesity
Feb 27, 2020
This chart shows the percentage of Americans who are obese based on a height and weight survey.
More Information
Immigrant Voters
Feb 27, 2020
This chart shows eligible foreign-born voters in the U.S. by year.
More Information
Coronavirus
Feb 25, 2020
This chart shows new daily confirmed COVID-19 cases and recoveries worldwide.
More Information
NBA
Feb 12, 2020
This chart shows the value of NBA franchises in 2020 (in million U.S. dollars).
More Information
Entertainment
Feb 5, 2020
This chart shows the podcasts/podcasters with the highest earnings in 2019.
More Information
Tech Jobs
Jan 27, 2020
This chart shows the size of the total tech labor force in 2018 and relative growth between 2013-2018 in a given city.
More Information
iPad
Jan 23, 2020
This chart shows revenue for the iPad as a share of Apple's total global revenue from 3rd quarter 2010 to 4th quarter 2019.
More Information
Polarization
Jan 22, 2020
This chart shows the approval percentages of presidents by party in a given year.
More Information
Suicide
Jan 14, 2020
This chart shows the total number of workplace suicides in the U.S. by year.
More Information
The Way We Work is Changing
Jan 13, 2020
This infographic looks at how the way we work is changing.
More Information
Cancer
Jan 8, 2020
This chart shows the cancer death rates per 100,000 people in the U.S.
More Information
Free-to-Play Games
Jan 3, 2020
This chart shows worldwide revenue generated with free-to-play video games in 2019, by platform.
More Information
Fortnite
Jan 3, 2020
This chart ranks the top 5 free-to-play digital games by worldwide revenue in 2019.
More Information
Media Consumption
Nov 29, 2019
This chart breaks down digital media consumption in the United States by platform.
More Information
Foreign-born Population
Sep 4, 2019
This chart shows the U.S. metros with the largest increases in foreign-born population.
More Information
6
/
7
Contact
Get in touch with us. We are happy to help.
Do you still have questions?
Feel free to contact us anytime using our
contact form
or visit our
FAQ page
.
Your contact to the Infographics Newsroom
Felix Richter
Data Journalist
felix.richter@statista.com
+49 (40) 284 841 557