Skip to main content
Consumer Goods & FMCG
E-Commerce
Economy & Politics
Energy & Environment
Health, Pharma & Medtech
Internet
Media
Technology & Telecommunications
Transportation & Logistics
Travel, Tourism & Hospitality
View all industries
Global data volume growth
Global AI market size
Number of generative AI users worldwide
Global inflation rate
Retail e-commerce sales worldwide
Largest economies worldwide
Biggest social media platforms by users
Global EV market share by manufacturer
International tourist arrivals by world region
Global annual CO₂ emissions
Browse recent statistics
Artificial intelligence (AI) worldwide
TikTok
Nvidia
E-commerce worldwide
Global GDP
Instagram
Apparel market worldwide
Video gaming worldwide
Global renewable energy industry
Influencer marketing worldwide
Browse recent topics
Consumer Trends 2026
Artificial Intelligence: in-depth market analysis
E-commerce challenges
Global economy
TikTok
Luxury goods: in-depth market analysis
Electric vehicles: A global overview
Video gaming worldwide
Travel and tourism trends 2026
Battery recycling worldwide
Browse recent reports
Explore the tool
Explore Classic mode
Advertising & Media
eCommerce
Consumer
Finance
Global Indicators
Health
Industrial
Mobility
Technology
Explore Market Insights
eCommerce Insights
Research AI
Book a demo
All integrations
Developer docs
Explore Statista Connect
Research
Strategy & Consulting
Marketing
Media & PR
Explore AI assistants
Marketing
Research & Development
Strategy
Sales
Find the fact
Tell the story
Win the pitch
Understand the market
Develop your strategy
Academia
Agencies
Consultancies
Consumer goods
Finance
Tech
Research solutions
Strategy consulting
Communication services
Explore Statista+
Statista R
Statista Healthcare
About Statista
First steps & help center
Webinar & training hub
Success stories
Individuals & Small Teams
Businesses & Enterprises
Academia & Government
English
Deutsch
Daily Data
Infographics on the topic "statista trend"
Crime
Nov 2, 2022
This chart shows the share of U.S. adults who said that there was more crime in their area than a year ago (in percent).
More Information
Advertising
Oct 26, 2022
This chart shows year-over-year growth in advertising spending in the United States, by medium.
More Information
Anti-Semitism
Oct 25, 2022
This chart shows the number of anti-Semitic incidents recorded in the U.S.
More Information
Life Expectancy
Oct 18, 2022
This chart shows the change in life expectancy in selected countries between 2019 and 2021 (in months).
More Information
Ukraine War
Oct 14, 2022
This chart shows net legal entries* of Russians into European countries between Sept 19 and Oct 2, 2022.
More Information
inflation
Oct 13, 2022
This chart shows which issues people are most worried about globally as of September 2022.
More Information
Mental Health
Sep 28, 2022
This chart shows the countries with the highest (worst) scores in the Negative Experience Index in 2021.
More Information
Covid-19 Pandemic
Sep 15, 2022
This chart shows the number of weekly Covid-19 deaths worldwide since January 2020.
More Information
Sports
Sep 6, 2022
This chart shows the share of U.S. sports fans who follow major professional leagues.
More Information
Sponsored Post
Sep 5, 2022
This graphic shows that sustainable accommodations matter to travelers.
More Information
Quiet quitting
Sep 1, 2022
This chart shows awareness and understanding of the term "quiet quitting" among U.S. adults.
More Information
Work life
Sep 1, 2022
This chart shows the share of U.S. adults agreeing with the following statements on work, by age group.
More Information
Sponsored Post
Aug 30, 2022
This graphic shows that sustainable efforts of accommodations are appreciated by their guests.
More Information
Automotive
Aug 25, 2022
This chart shows General Motors' worldwide electric vehicle sales from 2013 to 2021.
More Information
Unicorns in Europe
Aug 23, 2022
This chart shows the European countries with the highest number of unicorns.
More Information
raw materials
Aug 22, 2022
This chart shows the year on year change of aluminum production in western and central Europe from June 2021.
More Information
Video streaming services
Aug 15, 2022
This chart shows the share of respondents with the following number of paid streaming subscriptions in 2019/2022.
More Information
economy
Aug 9, 2022
More Information
economy
Aug 1, 2022
This chart shows the total trade volume between China and Africa between 2003 and 2021.
More Information
Microchips
Aug 1, 2022
This chart shows countries with the biggest export values of electronic integrated circuits in 2020 (in billion U.S. dollars).
More Information
Digital Payments
Jul 15, 2022
This chart shows the share of U.S. respondents who said they had used the following online payment methods in the past 12 months.
More Information
democracy
Jul 4, 2022
This chart shows the democracy indexes in the U.S. as defined by the Economist Intelligence Unit, between 2006-2020.
More Information
UK census
Jun 29, 2022
This chart shows the share of the population by age bracket in England and Wales in 2021.
More Information
Health
Jun 28, 2022
This chart shows the number of abortions reported in U.S. states with 'trigger laws' in place from 2010 to 2019.
More Information
Incarceration
Jun 28, 2022
This chart shows foreign prisoners as a percentage of the total prison population.
More Information
Inflation Outpaces Wages
Jun 16, 2022
This chart shows the year-over-year change in consumer prices, real and nominal hourly earnings in the UK.
More Information
drug trafficking
Jun 16, 2022
This chart shows the rise in the number of stimulant drug seizures between 2010 - 2020.
More Information
Abortion Rate
Jun 16, 2022
This chart show the abortion rate in the U.S. between 1973 and 2020 as calculated by the Guttmacher Institute.
More Information
VC Investment
Jun 1, 2022
This chart shows venture capital investments in China and India (in billion U.S. dollars) in Q1 of 2021 and Q1 of 2022 as well as the...
More Information
Chinese Logistics Market
May 30, 2022
This chart shows the shares of the Chinese outbound B2C logistics market held by different shipping modes (in percent).
More Information
the wealth gap
May 23, 2022
This chart shows how the top ten richest people in the UK are the wealthiest group the country has ever seen.
More Information
Newspapers in India
May 18, 2022
This chart shows the circulation of print newspapers and periodicals in India, in copies per publishing day (in millions).
More Information
Military Expenditure
May 18, 2022
This chart shows total military expenditure by country in 2021.
More Information
LGBTI
May 17, 2022
This chart shows the worst scoring countries on laws, policies and practices affecting LGBTI people in 2022.
More Information
NHS crisis
May 16, 2022
This chart shows the number of people on waiting lists for routine procedures between 2007 and March 2022.
More Information
Religion
May 11, 2022
This chart shows the share of the population that identifies as an atheist or non-religious by region.
More Information
Smoking
May 9, 2022
This chart shows the share of population (15+) that said they smoke daily in 2019.
More Information
IoT
Apr 26, 2022
This chart shows the estimated numbers of household worldwide with smart devices in 2022 and 2027.
More Information
Employment Trends
Apr 20, 2022
This chart shows how employees want greater flexibility in their work schedules.
More Information
U.S. Perceptions of Russia
Apr 8, 2022
This chart shows how U.S. respondents would categorize the U.S. relationship with Russia.
More Information
Society
Apr 4, 2022
Share of adults in Afghanistan who rated their lives on a scale of 0-10 which is classified as 'suffering'.
More Information
Retail
Mar 30, 2022
This chart shows GameStop's revenue per fiscal year by product category.
More Information
Future of Work
Mar 23, 2022
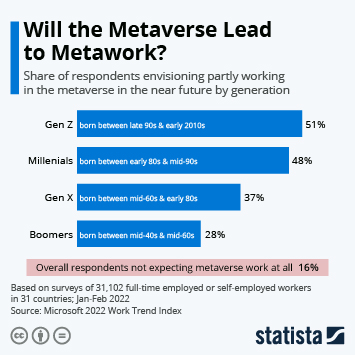
This chart shows the share of respondents envisioning partly working in the metaverse in the near future by generation.
More Information
Cybersecurity
Mar 18, 2022
This chart shows the biggest corporate endpoint protection providers by market share.
More Information
Stock market
Feb 24, 2022
This chart shows the year-to-date development of biggest U.S. stock market indices.
More Information
E-Commerce
Feb 15, 2022
This chart shows the e-commerce brands with the highest revenue in Europe in 2020.
More Information
Retail
Feb 11, 2022
This chart shows total expected Valentine's Day spending in the U.S.
More Information
Economy
Feb 2, 2022
This chart shows cities ranked according to the Statista Global Business Cities Index.
More Information
Video on demand
Jan 28, 2022
This chart shows the number of countries the world's biggest streaming services are available in.
More Information
Startup Economy
Jan 20, 2022
This chart shows the leading cities for startups in Africa.
More Information
Life
Jan 11, 2022
This chart shows the most popular New Year's resolutions for 2022.
More Information
Life
Jan 11, 2022
This chart shows the most common New Year's resolutions in the United States in 2022.
More Information
Music through the decades
Jan 7, 2022
This chart shows the mean song duration of currently streamable songs by year of release.
More Information
Society
Dec 9, 2021
This chart shows the average level of happiness in the UK from 2015 to 2021.
More Information
Company Profits
Dec 3, 2021
This chart shows the quarterly operation profits of Samsung (in billion U.S. dollars).
More Information
Tech
Nov 26, 2021
This chart shows the global average daily time spent on social media per internet user from 2012 to 2021.
More Information
Economy
Nov 25, 2021
This chart shows the monthly U.S. consumer sentiment index, by political party support from 2016 to 2021.
More Information
Evictions
Nov 23, 2021
This chart shows the number of eviction filings tracked in selected cities before and after the end of the CDC moratorium (2021).
More Information
UK
Nov 23, 2021
This chart shows the approval rating of Boris Johnson.
More Information
Automotive industry
Nov 11, 2021
This chart shows the biggest publicly traded automakers by market cap.
More Information
Food
Sep 9, 2021
This chart shows a forecast for the market value of edible insects worldwide to 2023.
More Information
Celebrity
Sep 8, 2021
This chart shows the relative Google Search interest in the United States for 'Free Britney' in 2021.
More Information
EU Travel Zone
Aug 31, 2021
This chart shows countries from where it is allowed to enter the EU and Schengen areas amid the COVID-19 pandemic (as of August 31,...
More Information
Economic Impact of COVID-19
Aug 20, 2021
This chart shows weekly initial jobless claims in the United States since January 2020.
More Information
Digital and analogue music in the UK
Jul 28, 2021
The chart shows the percentage of people listening to music for a given amount of hours in the UK.
More Information
Opioid Epidemic
Jul 22, 2021
This chart shows the percentage change in reported drug overdose deaths by U.S. state.
More Information
Olympics
Jul 7, 2021
This chart shows current sports in the Summer Olympic Games by year of their addition (1984-2020/21).
More Information
Sport
Jul 2, 2021
This chart shows Google Search interest in England for the term 'it's coming hone' during Euro 2020.
More Information
Wildfires
Jul 2, 2021
This chart shows total wildfires recorded daily in the western U.S. wildland-urban interface.
More Information
Traffic Fatalities
Jun 15, 2021
This chart shows total U.S. traffic fatalities by year and fatality rate per 100 million vehicle miles traveled.
More Information
Economy
May 27, 2021
This chart shows the change in total UK goods imports from top five import partners from Q1 2018 to Q1 2021.
More Information
Agriculture
May 20, 2021
This chart shows the import of selected grains into China.
More Information
Health
May 19, 2021
This chart shows the countries with the biggest changes in total per capita alcohol consumption between 2010 and 2018.
More Information
Employee Safety
May 17, 2021
This chart shows the number of stroke and ischemic heart disease deaths caused by long working hours in 2016.
More Information
NFTs
May 6, 2021
This chart shows auction prices paid for NFTs of popular internet memes.
More Information
COVID-19
May 5, 2021
This chart shows the countries with the highest increase in new confirmed COVID-19 deaths between April 20 and May 4, 2021.
More Information
Economy
May 4, 2021
This chart shows the change in price of selected cryptocurrencies in 2021.
More Information
Electric Vehicles
Apr 29, 2021
This chart shows the projected number of electric vehicles driving globally up to 2030.
More Information
Academy Awards
Apr 23, 2021
This chart shows the average TV viewership of major award shows in the United States.
More Information
Drugs
Apr 20, 2021
This chart shows the percentage of U.S. adults who think marijuana should be made legal.
More Information
Infrastructure
Apr 6, 2021
This chart shows U.S. states by number of structurally deficient bridges in 2020.
More Information
Frequent Flyers
Mar 31, 2021
Estimated share of the population who take the largest total share of flights.
More Information
Education
Mar 29, 2021
This chart shows the number of children in the world below the minimum proficiency level in reading.
More Information
Biden Press Conference
Mar 25, 2021
This chart shows the average number of press conference held by sitting U.S. presidents and days until first solo conference.
More Information
House Prices
Mar 18, 2021
This chart shows the year-over-year change in house prices by country.
More Information
Emissions
Mar 2, 2021
This chart shows the percent year-over-year change in global carbon dioxide emissions in 2020.
More Information
Golden Globes
Feb 25, 2021
This chart shows the number of 'Best Picture' winners at the Oscars since 1950 that did/did not win a Golden Globe before.
More Information
U.S. Federal Prison System
Feb 25, 2021
This chart shows the number of federal inmates in custody excluding private prisons.
More Information
Coronavirus
Feb 23, 2021
This chart shows the percentage of U.S. adults who will get a coronavirus vaccine once it becomes available.
More Information
Internet Quality
Feb 23, 2021
This chart shows the countries with the highest and lowest scores on the Internet Quality Index (2020).
More Information
5
/
7
Contact
Get in touch with us. We are happy to help.
Do you still have questions?
Feel free to contact us anytime using our
contact form
or visit our
FAQ page
.
Your contact to the Infographics Newsroom
Felix Richter
Data Journalist
felix.richter@statista.com
+49 (40) 284 841 557