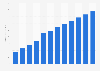
In the fourth quarter of 2022, advertising technology companies publically traded in the United States recorded an average year-on-year growth rate of 5.3 percent. During the presented period, the growth rate was the highest in the second quarter of 2021, when it stood at 48.5 percent.
Change in advertising technology industry revenue in the United States from 1st quarter 2019 to 4th quarter 2022
Basic Account
Get to know the platform
You only have access to basic statistics.
This statistic is not included in your account.
Starter Account
The ideal entry-level account for individual users
- Instant access to 1m statistics
- Download in XLS, PDF & PNG format
- Detailed references
$199 USD / Month *
Professional Account
Full access
Business Solutions including all features.
* Prices do not include sales tax.
Other statistics that may interest you Statistics on
About the industry
10
- Premium Statistic Ad revenue of media & entertainment industry India 2019-2024, by segment
- Premium Statistic Digital video advertising spending in the UK 2011-2023
- Premium Statistic Spending on digital video advertising in Russia 2021-2022, by type
- Premium Statistic Estimated online advertising expenditure Philippines 2023, by subcategory
- Premium Statistic Share of media ad spends in India 2016-2025, by channel
- Premium Statistic Market share of digital advertising platforms in China 2021-2023
- Premium Statistic Digital advertising spending in the UK H1 2022, by format
- Premium Statistic Ad spending share of digital advertising Philippines 2017-2027
- Premium Statistic Media owners ad revenue in the U.S. 2022, by medium
- Premium Statistic Search advertising spending in the UK 2008-2022
About the region
10
- Premium Statistic Amazon's share in search ad spend in the U.S. 2019-2023
- Premium Statistic Revenue of the social media advertising industry in the U.S. 2019-2028
- Premium Statistic Leading online news brands in the U.S. 2023
- Premium Statistic Social network ad spend in the U.S. 2021-2025
- Premium Statistic Most purchased ePublishing products in the U.S. 2023
- Premium Statistic Digital Market Outlook: video ad spending per internet user U.S. 2019-2028, by device
- Premium Statistic Digital Market Outlook: banner advertising spending in the U.S. 2019-2028, by device
- Premium Statistic Digital Market Outlook: digital video ad spending in the U.S. 2019-2028, by device
- Premium Statistic Digital Market Outlook: search ad spend per internet user U.S. 2019-2028, by device
- Premium Statistic Digital Market Outlook: search ad spending in the U.S. 2019-2028, by device
Selected statistics
1
Other regions
10
- Premium Statistic Distribution of FMCG advertising expenditure India by channel 2023
- Basic Statistic Share of online video advertising spending in Ukraine 2018
- Premium Statistic Expenditure on media advertising in Finland in 1995-2022
- Premium Statistic Digital advertising spending share of total media ad spending in Singapore 2015-2020
- Premium Statistic Digital advertising spending share of total media ad spending in Malaysia 2015-2020
- Premium Statistic Digital advertising spending share of media ad spending in Asia Pacific 2015-2020
- Premium Statistic Digital advertising expenditure share in Indonesia 2018-2020
- Premium Statistic Forecasted digital ad spending share of total media ad spending Thailand 2015-2020
- Premium Statistic Most-used social media channels by companies in Vietnam 2020
- Premium Statistic Consumer attitudes towards online advertising Australia 2020
Related statistics
10
- Premium Statistic AdTech companies - revenues 2022
- Premium Statistic Digital advertising spending in the UK 2008-2020, by format
- Premium Statistic Digital marketing use in the Sweden 2020, by channel
- Basic Statistic Impact of the coronavirus pandemic on marketing investments in Sweden 2020
- Premium Statistic Revenue of the social media advertising industry in the UK 2019-2028
- Premium Statistic Global internet advertising revenue 2018-2027
- Premium Statistic Digital classified ad revenue change UK 2019-2027, by category
- Premium Statistic Digital Market Outlook: digital classified ad spend change U.S. 2019-2027, category
- Premium Statistic Digital Market Outlook: video ad revenue per internet user UK 2019-2028, by device
- Premium Statistic Digital Market Outlook: banner advertising revenue in the UK 2019-2028, by device
Further related statistics
1
Further Content: You might find this interesting as well
Statista. (March 28, 2023). Change in advertising technology industry revenue in the United States from 1st quarter 2019 to 4th quarter 2022 [Graph]. In Statista. Retrieved May 21, 2024, from https://www.statista.com/statistics/1376479/advertising-technology-revenue-growth-usa/
Statista. "Change in advertising technology industry revenue in the United States from 1st quarter 2019 to 4th quarter 2022." Chart. March 28, 2023. Statista. Accessed May 21, 2024. https://www.statista.com/statistics/1376479/advertising-technology-revenue-growth-usa/
Statista. (2023). Change in advertising technology industry revenue in the United States from 1st quarter 2019 to 4th quarter 2022. Statista. Statista Inc.. Accessed: May 21, 2024. https://www.statista.com/statistics/1376479/advertising-technology-revenue-growth-usa/
Statista. "Change in Advertising Technology Industry Revenue in The United States from 1st Quarter 2019 to 4th Quarter 2022." Statista, Statista Inc., 28 Mar 2023, https://www.statista.com/statistics/1376479/advertising-technology-revenue-growth-usa/
Statista, Change in advertising technology industry revenue in the United States from 1st quarter 2019 to 4th quarter 2022 Statista, https://www.statista.com/statistics/1376479/advertising-technology-revenue-growth-usa/ (last visited May 21, 2024)
Change in advertising technology industry revenue in the United States from 1st quarter 2019 to 4th quarter 2022 [Graph], Statista, March 28, 2023. [Online]. Available: https://www.statista.com/statistics/1376479/advertising-technology-revenue-growth-usa/