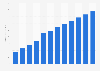
In January 2021, the demand for ad blocking software was highest in Europe. Europeans carried out 12.05 thousand searches for ad blocking software per 100,000 internet users. Asia ranked second with 3.57 thousand searches.
Number of searches for ad blocking software per 100,000 internet users worldwide in January 2021, by region
Basic Account
Get to know the platform
You only have access to basic statistics.
This statistic is not included in your account.
Starter Account
The ideal entry-level account for individual users
- Instant access to 1m statistics
- Download in XLS, PDF & PNG format
- Detailed references
$199 USD / Month *
Professional Account
Full access
Business Solutions including all features.
* Prices do not include sales tax.
Other statistics that may interest you Statistics on
About the industry
10
- Premium Statistic Number of desktop adblock users worldwide 2013-2023
- Premium Statistic Adblocking: penetration rate 2022, by country
- Premium Statistic Share of internet users using adblock software in Poland Q2 2014-Q2 2015
- Premium Statistic Demand for ad blocking software in North America 2021, by country
- Premium Statistic Demand for ad blocking software in Latin America 2021, by country
- Basic Statistic Ad blocker usage in Sweden 2020, by device
- Basic Statistic Ad blocker usage in Denmark 2020, by device
- Basic Statistic Ad blocker usage in Norway 2020, by device
- Basic Statistic Ad blocker usage in the United Kingdom (UK) 2016-2020
- Basic Statistic Ad blocker usage in Sweden 2016-2020
About the region
9
- Premium Statistic Adblocking: number of users 2013-2023
- Premium Statistic Number of electric vehicles in use by country 2022
- Premium Statistic Users of ad blocking software worldwide 2020, by region
- Premium Statistic Market share of EV battery types - China vs rest of world 2020
- Premium Statistic Cobalt content in EV lithium-ion batteries - by battery type 2018
- Premium Statistic Inverter installations by manufacturer - electric vehicles 2013
- Basic Statistic Top factors that influence mobile gamers to try a new genre 2018
- Premium Statistic Second screen usage of Gen Z when watching TV 2018
- Premium Statistic Global teen and young adults second screen usage Q2 2017
Other regions
10
- Basic Statistic Ad blocker usage in Denmark 2016-2020
- Premium Statistic Adblocking penetration rate in the U.S. Q2 2020, by gender
- Premium Statistic Ad blocker usage in Finland 2016-2020
- Basic Statistic Ad blocker users in the United Kingdom (UK) 2020, by age group
- Basic Statistic Ad blocker users in Norway 2020, by age group
- Basic Statistic Ad blocker users in Germany 2020, by age group
- Premium Statistic Ad blocker users in Sweden 2020, by age group
- Premium Statistic Popularity of ad blocking in Spain 2016-2021
- Premium Statistic Demand for ad blocking software in Europe 2021, by country
- Premium Statistic Market share of web tool and plugin software Australia 2019
Related statistics
9
- Premium Statistic Adblocking penetration rate in the U.S. Q2 2020, by age group
- Premium Statistic Ad blocker users in Finland 2020, by age group
- Premium Statistic Ad blocker users in the Nordics 2020, by country and gender
- Basic Statistic Ad blocker usage in Finland 2020, by device
- Basic Statistic Ad blocker usage in Germany 2018-2020
- Basic Statistic Ad blocker usage in the United Kingdom (UK) 2020, by device
- Basic Statistic Ad blocker usage in Germany 2020, by device
- Premium Statistic Users of ad blockers in the United Kingdom (UK) 2020, by gender
- Premium Statistic Users of ad blockers in Germany 2020, by gender
Further related statistics
9
- Consumers' likelihood of choosing soft drinks in the UK 2012, by gender
- Pfizer's ad spending 2006-2023
- Paid ad methods used for B2C content marketing North America 2022
- Per capita consumer spending in India 1974-2012
- Life insurance coverage sentiment in the U.S. 2016, by age
- Use of smartphones by shoppers in retail stores in Italy in 2015
- Loyalty program ownership in U.S. restaurants as of November 2013, by restaurant type
- Consumers willingness to share personal data with retailers in the UK in 2013, by age
- Resources shoppers use most often to make purchase decisions in the UK 2013
Further Content: You might find this interesting as well
Statistics
- Consumers' likelihood of choosing soft drinks in the UK 2012, by gender
- Pfizer's ad spending 2006-2023
- Paid ad methods used for B2C content marketing North America 2022
- Per capita consumer spending in India 1974-2012
- Life insurance coverage sentiment in the U.S. 2016, by age
- Use of smartphones by shoppers in retail stores in Italy in 2015
- Loyalty program ownership in U.S. restaurants as of November 2013, by restaurant type
- Consumers willingness to share personal data with retailers in the UK in 2013, by age
- Resources shoppers use most often to make purchase decisions in the UK 2013
SurfShark. (March 4, 2021). Number of searches for ad blocking software per 100,000 internet users worldwide in January 2021, by region [Graph]. In Statista. Retrieved April 26, 2024, from https://www.statista.com/statistics/681784/adblocking-penetration/
SurfShark. "Number of searches for ad blocking software per 100,000 internet users worldwide in January 2021, by region." Chart. March 4, 2021. Statista. Accessed April 26, 2024. https://www.statista.com/statistics/681784/adblocking-penetration/
SurfShark. (2021). Number of searches for ad blocking software per 100,000 internet users worldwide in January 2021, by region. Statista. Statista Inc.. Accessed: April 26, 2024. https://www.statista.com/statistics/681784/adblocking-penetration/
SurfShark. "Number of Searches for Ad Blocking Software per 100,000 Internet Users Worldwide in January 2021, by Region." Statista, Statista Inc., 4 Mar 2021, https://www.statista.com/statistics/681784/adblocking-penetration/
SurfShark, Number of searches for ad blocking software per 100,000 internet users worldwide in January 2021, by region Statista, https://www.statista.com/statistics/681784/adblocking-penetration/ (last visited April 26, 2024)
Number of searches for ad blocking software per 100,000 internet users worldwide in January 2021, by region [Graph], SurfShark, March 4, 2021. [Online]. Available: https://www.statista.com/statistics/681784/adblocking-penetration/