Skip to main content
Consumer Goods & FMCG
E-Commerce
Economy & Politics
Energy & Environment
Health, Pharma & Medtech
Internet
Media
Technology & Telecommunications
Transportation & Logistics
Travel, Tourism & Hospitality
View all industries
Global data volume growth
Global AI market size
Number of generative AI users worldwide
Global inflation rate
Retail e-commerce sales worldwide
Largest economies worldwide
Biggest social media platforms by users
Global EV market share by manufacturer
International tourist arrivals by world region
Global annual CO₂ emissions
Browse recent statistics
Artificial intelligence (AI) worldwide
TikTok
Nvidia
E-commerce worldwide
Global GDP
Instagram
Apparel market worldwide
Video gaming worldwide
Global renewable energy industry
Influencer marketing worldwide
Browse recent topics
Consumer Trends 2026
Artificial Intelligence: in-depth market analysis
E-commerce challenges
Global economy
TikTok
Luxury goods: in-depth market analysis
Electric vehicles: A global overview
Video gaming worldwide
Travel and tourism trends 2026
Battery recycling worldwide
Browse recent reports
Explore the tool
Explore Classic mode
Advertising & Media
eCommerce
Consumer
Finance
Global Indicators
Health
Industrial
Mobility
Technology
Explore Market Insights
eCommerce Insights
Research AI
Book a demo
All integrations
Developer docs
Explore Statista Connect
Research
Strategy & Consulting
Marketing
Media & PR
Explore AI assistants
Marketing
Research & Development
Strategy
Sales
Find the fact
Tell the story
Win the pitch
Understand the market
Develop your strategy
Academia
Agencies
Consultancies
Consumer goods
Finance
Tech
Research solutions
Strategy consulting
Communication services
Explore Statista+
Statista R
Statista Healthcare
About Statista
First steps & help center
Webinar & training hub
Success stories
Individuals & Small Teams
Businesses & Enterprises
Academia & Government
English
Deutsch
Daily Data
Infographics on the topic "+"
Dec 18, 2014
This chart shows countries with the highest number of jailed journalists in 2014.
More Information
Dec 18, 2014
This chart shows real and fake christmas trees sold in the U.S. from 2007 to 2013.
More Information
Dec 18, 2014
This chart illustrates how the Silicon Valley 150, the largest companies in the hot bed for tech startups, lag behind S&P 100 companies...
More Information
Dec 17, 2014
The top-ten earners in music worldwide.
More Information
Dec 16, 2014
This chart shows the percentage approval among Ukrainians of leadership in the following countries.
More Information
Dec 16, 2014
"I am looking forward to Christmas this year" - Agree/Disagree?
More Information
Dec 16, 2014
This chart ranks the Top 10 mobile phone vendors in Q3 2014, based on worldwide unit sales to end users.
More Information
Dec 15, 2014
This chart shows the top 10 Christmas albums by units sold in the United States since 1991.
More Information
Dec 12, 2014
This chart shows global deaths from Jihadist violence in November 2014 by group responsible.
More Information
Dec 12, 2014
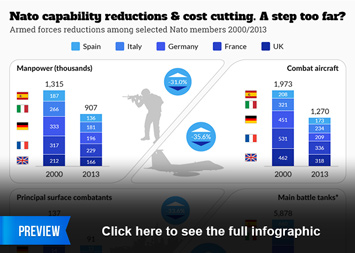
This chart shows armed forces reductions among selected Nato members 2000/2013.
More Information
Dec 12, 2014
This chart shows the most charitable nations in the world according to the 2014 World Giving Index.
More Information
Dec 11, 2014
This chart shows the countries with the most deaths from Jihadist violence in November 2014.
More Information
Dec 11, 2014
This chart shows the percentage of e-commerce transactions happening on mobile devices in selected countries.
More Information
Dec 10, 2014
This chart shows the top 10 recipients of international climate finance over the past decade.
More Information
Dec 9, 2014
This chart shows per-capita advertising expenditure for the ten largest advertising markets in the world.
More Information
Dec 9, 2014
This chart shows the percentage of annual income spent on gasoline by country in 2014.
More Information
Dec 9, 2014
Is it acceptable/unacceptable for a woman to breastfeed in these places?
More Information
Dec 8, 2014
This chart shows the percentage of Americans who used the following for photography in August 2014.
More Information
Dec 8, 2014
This chart shows the percentage of total bribes by multinational industry.
More Information
Dec 8, 2014
This chart shows James Bond films by release year and estimated earnings.
More Information
Dec 5, 2014
This chart illustrates the importance of internet access as perceived by people from different regions of the world.
More Information
Dec 5, 2014
This chart shows graduates as a percentage of the workforce in selected cities in 2014.
More Information
Dec 4, 2014
On average, how often, if at all, are you late for work?
More Information
Dec 3, 2014
How serious a threat do the following groups/countries pose to Britain?
More Information
Dec 3, 2014
This chart shows the percentage of shares by sharing channel.
More Information
Dec 3, 2014
This chart shows the child poverty rate and percentage change in selected countries between 2008 and 2012.
More Information
Dec 2, 2014
This chart shows a forecast of the worldwide smartphone market share in 2014.
More Information
Dec 2, 2014
This chart shows the number of countries/jurisdictions requiring picture warnings on cigarette packages.
More Information
Dec 1, 2014
This chart shows the % who have done each of the following once/frequently while driving.
More Information
Dec 1, 2014
This chart shows U.S. online spending on Cyber Monday from 2005 to 2013.
More Information
Nov 28, 2014
This chart shows if and how internet users around the world have changed their behavior following last year's revelations by Edward...
More Information
Nov 27, 2014
This chart shows a forecast of worldwide PC and tablet shipments in 2014 and 2018.
More Information
Nov 27, 2014
This chart illustrates key facts about Black Friday, one of the most important days of the year for retailers in the United States.
More Information
Nov 26, 2014
This chart illustrates that the majority of people across all world regions thinks that affordable internet access should be a basic...
More Information
Nov 24, 2014
This chart shows unauthorized immigrants as a percentage of the total state population.
More Information
Nov 24, 2014
This chart shows police personnel per 100,000 of the population.
More Information
Nov 24, 2014
This chart breaks down North American internet traffic during peak hours by application.
More Information
Nov 21, 2014
This chart shows how Americans spent their free time in 2013.
More Information
Nov 21, 2014
This chart shows actual and perceived tax expenditure in the United Kingdom in 2014.
More Information
Nov 21, 2014
This chart shows the results of a survey asking people how they think life on Earth began originally.
More Information
Nov 20, 2014
This chart illustrates the rise of holiday season e-commerce spending in the United States from 2005 through 2013 and a forecast of...
More Information
Nov 20, 2014
This chart shows the top ten countries with the most deaths from terrorist incidents in 2013.
More Information
Nov 19, 2014
This chart shows worldwide vinyl music sales since 1997.
More Information
Nov 19, 2014
This chart shows the number of people living in slavery by region in 2014.
More Information
Nov 18, 2014
This chart shows a forecast of global smartphone subscriptions and mobile smartphone data traffic.
More Information
Nov 18, 2014
This chart shows who makes the most positive/negative contribution to political debate.
More Information
Nov 18, 2014
This chart shows the percentage supporting military airstrikes against Islamic military groups including ISIL in Iraq and Syria.
More Information
Nov 18, 2014
This chart shows which charitable causes Americans care most deeply about and what causes they are most likely to donate to.
More Information
Nov 17, 2014
This chart shows the top business schools for billionaire alumni.
More Information
Nov 14, 2014
This chart shows the year-over-year growth of video game hardware sales in the United States.
More Information
Nov 13, 2014
This chart provides all the main facts about online shopping.
More Information
Nov 12, 2014
This chart shows which social platforms are the most essential for brands around the world.
More Information
Nov 12, 2014
This chart shows the number of places pledged to Syrian refugees as of November 2014.
More Information
Nov 12, 2014
This chart shows the level of trust placed in various US institutions over the past few years.
More Information
Nov 11, 2014
This chart shows the estimated number of smart connected things in use wordwide.
More Information
Nov 11, 2014
This chart shows how the world's wealth is shared amongst its population, by income group.
More Information
Nov 10, 2014
This chart shows the percentage of people finding the following professions prestigious.
More Information
Nov 10, 2014
This chart shows the worldwide desktop market share of the world's second and third most popular web browsers: Google Chrome and Mozilla...
More Information
Nov 7, 2014
This chart shows voting intentions for the November 9th Catalan independence vote.
More Information
Nov 7, 2014
This chart shows in which situations American smartphone users typically download apps.
More Information
Nov 7, 2014
This chart shows which countries made the most requests for Facebook user information in the first half of 2014.
More Information
Nov 6, 2014
This chart shows the percentage of adults living in "doubled up" households in selected US cities in 2000 and 2012.
More Information
Nov 5, 2014
This chart shows the prevalence of street harassment in the United States in 2014.
More Information
Nov 4, 2014
This chart shows the top family-controlled firms by revenue in 2013.
More Information
Nov 4, 2014
This chart shows the 10 most popular iOS and Android apps in the United States in September 2014.
More Information
Nov 4, 2014
This chart shows all the key facts about mobile app usage.
More Information
Nov 3, 2014
This chart shows how people in the UK planned to greet trick or treaters.
More Information
Nov 3, 2014
This chart shows funds raised by the Movember campaign in 2013.
More Information
Oct 31, 2014
This chart provides key facts about Halloween in the United States
More Information
Oct 31, 2014
This chart shows the countries where the highest number of journalists have been killed in 2014.
More Information
Oct 31, 2014
This chart shows the 10 countries that scored highest in the <a href="http://reports.weforum.org/global-gender-gap-report-2014/rankings/">Global...
More Information
Oct 30, 2014
This chart shows the percentage of traffic to a large sample of websites that comes social media websites.
More Information
Oct 30, 2014
This chart shows gold reserves in selected countries in metric tons in October 2014.
More Information
Oct 29, 2014
This chart shows which countries are the most dependent on remittances from emigrants.
More Information
Oct 29, 2014
This chart shows registered electric vehicles and percentage growth in the United States.
More Information
Oct 28, 2014
This chart illustrates Twitter's user growth since 2010.
More Information
Oct 28, 2014
This chart shows UK net contributions to the European budget from 2003 to 2013 (in million GBP).
More Information
Oct 28, 2014
This chart shows the percentage of Americans who frequently or occasionally worry about the following.
More Information
Oct 27, 2014
This chart shows the number of executions worldwide in 2013.
More Information
Oct 27, 2014
This chart shows which countries are the worst affected by hunger and hunger-related problems.
More Information
Oct 24, 2014
% change in the number of college graduates living in U.S. cities from 2000 to 2012.
More Information
Oct 24, 2014
This chart shows the world's highest posthumous earners in 2014.
More Information
Oct 23, 2014
This chart shows how many Americans have been subject to different forms of online harassment.
More Information
Oct 23, 2014
This chart gives an overview of the e-book industry.
More Information
Oct 22, 2014
This chart shows which devices Americans in different age groups use to watch TV series.
More Information
Oct 22, 2014
This chart shows funds pledged to fight the 2014 Ebola outbreak.
More Information
Oct 21, 2014
This chart shows the LP sales volume in the UK from 2009 to 2013.
More Information
Oct 21, 2014
This chart shows the estimated overall annual energy consumption of devices in U.S. households.
More Information
Oct 21, 2014
This chart shows dollar millionaires by country of residence in 2014.
More Information
Oct 20, 2014
This chart shows the year-over-year growth of global PC shipments since Q1 2010.
More Information
148
/
161
Contact
Get in touch with us. We are happy to help.
Do you still have questions?
Feel free to contact us anytime using our
contact form
or visit our
FAQ page
.
Your contact to the Infographics Newsroom
Felix Richter
Data Journalist
felix.richter@statista.com
+49 (40) 284 841 557