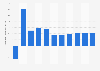
Banking revenue in the U.S. 2010-2022
A decade after the global financial crisis, the U.S. banking sector has not only resurrected, but also stands more resilient with an all-time high equity to assets ratio and return on average assets since 2000. In addition, the continuous decline in non-performing loans by the U.S. banks from more than 5% during the financial crisis to the current level of 1% is nothing but a testimony of good times. Thus, Statista’s forecast on the industry revenue surpassing the 500 billion mark by 2021 comes as no surprise.
Technology adoption is changing industry dynamics
The global banking sector has been one of the most aggressive adopters of digital technologies, with investments in the Fintech industry having registered an almost 500% increase over the period 2013-2018. Notably, the U.S. stands next to China in terms of adopting fintech in banking and payments sector. Interestingly, banks have also begun teaming up with Fintech startups to improve and expand their service offerings. In retail banking, online lending platforms and mobile banking usage is on the rise.
Robo advisors opened wealth management to mass market
Fintech pioneers such as PayPal have transformed the way payments are made globally. At the same time, robo advisory services have transformed the wealth management segment and opened new business avenues to attract mass-market customers who have limited assets to invest.