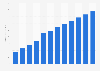
In 2019, programmatic advertising accounted for 77 percent of total digital advertising spending in Europe. This was a 23 percent increase from three years prior, when programmatic only made up slightly more than half of all digital ad spend. As the industry shifts towards programmatic transactions, adverts sold via the classic insertion order (IO) have decreased in share from 46 percent to 23 percent.
Distribution of digital advertising spending in Europe in 2016 and 2019, by transaction type
Basic Account
Get to know the platform
You only have access to basic statistics.
This statistic is not included in your account.
Single Account
The ideal entry-level account for individual users
- Instant access to 1m statistics
- Download in XLS, PDF & PNG format
- Detailed references
$59 $39 / Month *
in the first 12 months
Corporate Account
Full access
Corporate solution including all features.
* Prices do not include sales tax.
Further Content: You might find this interesting as well
Statistics
- Online ad spend growth in CEE 2000-2024
- Programmatic advertising spending in the Netherlands 2016-2020
- Programmatic ad spend in Peru 2017-2021
- Ecuador: programmatic ad CTR 2018
- Argentina: programmatic ad CPM 2018
- Puerto Rico: programmatic ad spend 2016-2021, by deal
- Ecuador: programmatic share in display ad spend 2012-2021
- Colombia: programmatic share in display ad spend 2016-2021
- Ad spend in Italy 2019-2020, by medium
- Ecuador: programmatic ad CPM 2018
- Programmatic ad spend in Ecuador 2017-2026
- Puerto Rico: programmatic ad spend 2016-2021
- Favorite ads from which consumers learn about online products in Poland 2020
- Cinema advertising spending in Israel 2008-2015
- Influencer following rate on social media in China 2020
IAB Europe. (October 1, 2020). Distribution of digital advertising spending in Europe in 2016 and 2019, by transaction type [Graph]. In Statista. Retrieved June 26, 2022, from https://www.statista.com/statistics/1177276/digital-ad-spend-share-transaction-type-europe/
IAB Europe. "Distribution of digital advertising spending in Europe in 2016 and 2019, by transaction type." Chart. October 1, 2020. Statista. Accessed June 26, 2022. https://www.statista.com/statistics/1177276/digital-ad-spend-share-transaction-type-europe/
IAB Europe. (2020). Distribution of digital advertising spending in Europe in 2016 and 2019, by transaction type. Statista. Statista Inc.. Accessed: June 26, 2022. https://www.statista.com/statistics/1177276/digital-ad-spend-share-transaction-type-europe/
IAB Europe. "Distribution of Digital Advertising Spending in Europe in 2016 and 2019, by Transaction Type." Statista, Statista Inc., 1 Oct 2020, https://www.statista.com/statistics/1177276/digital-ad-spend-share-transaction-type-europe/
IAB Europe, Distribution of digital advertising spending in Europe in 2016 and 2019, by transaction type Statista, https://www.statista.com/statistics/1177276/digital-ad-spend-share-transaction-type-europe/ (last visited June 26, 2022)