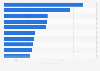
In 2023, users worldwide spent approximately 28 hours using the YouTube mobile app per month. Users in South Korea spent an average of approximately 45 hours and 49 minutes engaging with video content on the YouTube app, while users in Switzerland spent less than 10 hours monthly on the app. In the United States, each user spent approximately 25.56 hours on the mobile app of the popular social video platform in 2023.
Monthly time spent on the YouTube mobile app per user in selected markets worldwide as of December 2023
(in hours)
Characteristic
Time spent per user in hours
-
-
-
-
-
-
-
-
-
-
-
-
-
-
-
-
-
-
-
-
-
-
-
-
-
-
-
-
-
-
-
-
-
-
-
-
-
-
-
-
-
-
-
-
-
-
-
-
-
-
-
-
-
-
-
-
-
-
-
-
-
-
-
-
-
-
-
-
-
-
-
-
-
-
-
-
-
-
-
-
-
-
-
-
-
-
-
-
-
-
-
-
-
-
-
-
-
-
-
-
-
-
-
-
-
-
Exclusive Premium Statistic
To access all Premium Statistics, you need a paid Statista Account
Profit from the additional features of your individual account
Currently, you are using a shared account. To use individual functions (e.g., mark statistics as favourites, set
statistic alerts) please log in with your personal account.
If you are an admin, please authenticate by logging in again.
Learn more about how Statista can support your business.
DataReportal, & We Are Social, & Meltwater. (April 24, 2024). Monthly time spent on the YouTube mobile app per user in selected markets worldwide as of December 2023 (in hours) [Graph]. In Statista. Retrieved July 27, 2024, from https://www.statista.com/statistics/1287283/time-spent-youtube-app-selected-countries/
DataReportal, und We Are Social, und Meltwater. "Monthly time spent on the YouTube mobile app per user in selected markets worldwide as of December 2023 (in hours)." Chart. April 24, 2024. Statista. Accessed July 27, 2024. https://www.statista.com/statistics/1287283/time-spent-youtube-app-selected-countries/
DataReportal, We Are Social, Meltwater. (2024). Monthly time spent on the YouTube mobile app per user in selected markets worldwide as of December 2023 (in hours). Statista. Statista Inc.. Accessed: July 27, 2024. https://www.statista.com/statistics/1287283/time-spent-youtube-app-selected-countries/
DataReportal, and We Are Social, and Meltwater. "Monthly Time Spent on The Youtube Mobile App per User in Selected Markets Worldwide as of December 2023 (in Hours)." Statista, Statista Inc., 24 Apr 2024, https://www.statista.com/statistics/1287283/time-spent-youtube-app-selected-countries/
DataReportal & We Are Social & Meltwater, Monthly time spent on the YouTube mobile app per user in selected markets worldwide as of December 2023 (in hours) Statista, https://www.statista.com/statistics/1287283/time-spent-youtube-app-selected-countries/ (last visited July 27, 2024)
Monthly time spent on the YouTube mobile app per user in selected markets worldwide as of December 2023 (in hours) [Graph], DataReportal, & We Are Social, & Meltwater, April 24, 2024. [Online]. Available: https://www.statista.com/statistics/1287283/time-spent-youtube-app-selected-countries/