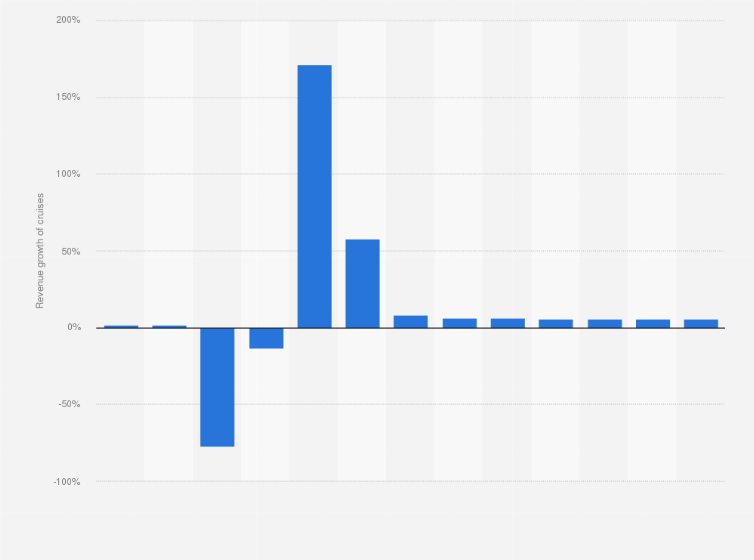
Revenue growth of cruises in Belgium 2018-2030

Log in or register to access precise data.

Revenue growth of cruises in Belgium from 2018 to 2030

CharacteristicRevenue growth of cruises
- -
- -
- -
- -
- -
- -
- -
- -
- -
- -
- -
- -
- -
Statistic: Revenue growth of cruises in Belgium from 2018 to 2030
Download
Show detailed source information?
Register for free
Already a member?
Log in
Sources

Use Ask Statista Research Service

Supplementary notes

Data were modeled for: 2018, 2019, 2020, 2021, 2022, 2023, 2024, 2025, 2026, 2027, 2028, 2029, and 2030.

Citation formats
Use Statista now: unlimited access to all content
Leading companies trust Statista:
paypal google adobe pg samsung telekom
Statista has been my savior on several occasions. The site is easy to maneuver and the data is in a format that can go right into a report or presentation.
Marlene Greenfield

Marlene Greenfield
Vice President, Hearst Magazines

Other statistics that may interest you

Other statistics that may interest you Statistics on

About the industry

10

About the region

10

Selected statistics

10

Other regions

10

Related statistics

10

Further related statistics

10

Discover Statista

Need help with using Statista for your research? Tutorials and first steps
Do you have any questions about our business solutions?

We provide you with detailed information about our Professional Account.

Use Statista now: unlimited access to all content
Learn more about how Statista can support your business.