In financial year 2021, around 19.9 percent of households in Australia that experienced a recent home break-in had personal items stolen. Personal items included handbags, jewelry, clothing, keys, bags, and sunglasses.
Advertisement
Advertisement
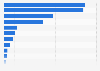
Share of items stolen in home break-ins in Australia in financial year 2021, by type
Characteristic
Share of stolen items
Personal items
19.9%
Bicycles/sporting equipment
17.9%
Money, purse, or wallet
15.7%
Tools
14.9%
Computer equipment
6.1%
Personal electronic or audio/visual equipment
5.1%
Mobile phone or smartphone
4.1%
Alcohol or food
3.8%
Other
10.1%
0%2%4%6%8%10%12%14%16%18%20%22%
Add this content to your personal favorites. These can be accessed from the favorites menu in the main navigation.
You have no right to use this feature.
Make sure to contact us if you are interested in scientific citation.
You can upgrade your account to enable this functionality for all statistics.
This feature is not available with your current account.Request access
most recent experience of a break-in in the last 12 months
Supplementary notes
Australia's financial year runs from July 1 to June 30 of the stated year; for example, financial year 2021 starts on July 1, 2020 and ends on June 30, 2021.
Money, purse, or wallet includes credit card.
Personal items includes handbag, jewelry, clothing, keys, bags, sunglasses etc.
Computer equipment includes tablet, laptop, PC, printer, games consoles etc.
Personal electronic or audio/visual equipment includes smart watch, digital camera, TV, DVD player, stereo etc. Excludes mobile phones and smartphones.
Learn more about how Statista can support your business.
Australian Bureau of Statistics. (February 22, 2022). Share of items stolen in home break-ins in Australia in financial year 2021, by type [Graph]. In Statista. Retrieved October 09, 2025, from https://www.statista.com/statistics/1338468/australia-household-break-in-items-stolen-by-type/
Australian Bureau of Statistics. "Share of items stolen in home break-ins in Australia in financial year 2021, by type." Chart. February 22, 2022. Statista. Accessed October 09, 2025. https://www.statista.com/statistics/1338468/australia-household-break-in-items-stolen-by-type/
Australian Bureau of Statistics. (2022). Share of items stolen in home break-ins in Australia in financial year 2021, by type. Statista. Statista Inc.. Accessed: October 09, 2025. https://www.statista.com/statistics/1338468/australia-household-break-in-items-stolen-by-type/
Australian Bureau of Statistics. "Share of Items Stolen in Home Break-ins in Australia in Financial Year 2021, by Type." Statista, Statista Inc., 22 Feb 2022, https://www.statista.com/statistics/1338468/australia-household-break-in-items-stolen-by-type/
Australian Bureau of Statistics, Share of items stolen in home break-ins in Australia in financial year 2021, by type Statista, https://www.statista.com/statistics/1338468/australia-household-break-in-items-stolen-by-type/ (last visited October 09, 2025)
Share of items stolen in home break-ins in Australia in financial year 2021, by type [Graph], Australian Bureau of Statistics, February 22, 2022. [Online]. Available: https://www.statista.com/statistics/1338468/australia-household-break-in-items-stolen-by-type/
Advertisement
Profit from additional features with an Employee Account
Please create an employee account to be able to mark statistics as favorites.
Then you can access your favorite statistics via the star in the header.
Profit from the additional features of your individual account
Currently, you are using a shared account. To use individual functions (e.g., mark statistics as favourites, set
statistic alerts) please log in with your personal account.
If you are an admin, please authenticate by logging in again.