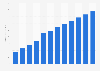
The statistic presents data on the growth of the global internet advertising spending between 2013 and 2018, broken down by category. PwC projected that internet display advertisement spending would grow by 7.4 percent annually in the presented period.
Compound annual growth rate of global internet advertising spending between 2013 and 2018, by category
Basic Account
Get to know the platform
You only have access to basic statistics.
This statistic is not included in your account.
Single Account
The ideal entry-level account for individual users
- Instant access to 1m statistics
- Download in XLS, PDF & PNG format
- Detailed references
$59 $39 / Month *
in the first 12 months
Corporate Account
Full access
Corporate solution including all features.
* Prices do not include sales tax.
Further Content: You might find this interesting as well
Statistics
- Online advertising spending distribution in the Netherlands 2017, by format
- Digital ad spend in the U.S. 2014-2019, by format
- Online advertising spending in Germany 2017-2020
- Local online advertising spending in the U.S. in 2013, by format
- Ranking of internet advertisers in Sweden 2016, by ad spending
- Ketel One Vodka: online ad spend in the U.S. 2010-2019
- Grey Goose Vodka: online ad spend in the U.S. 2010-2019
- Growth of local digital advertising spending in the U.S. 2001-2016
- Belvedere: online ad spend in the U.S. 2010-2019
- Tito's Handmade Vodka: online ad spend in the U.S. 2011-2019
- Three Olives Vodka: online ad spend in the U.S. 2011-2019
- Russian Standard: online ad spend in the U.S. 2010-2019
- Smirnoff Vodka: online ad spend in the U.S. 2010-2019
- Absolut Vodka: online ad spend in the U.S. 2010-2019
- Ciroc Vodka: online ad spend in the U.S. 2010-2019
- Svedka Vodka: online ad spend in the U.S. 2010-2019
- Skyy Vodka: online ad spend in the U.S. 2010-2019
- Largest online advertising markets in 2017
PwC. (June 4, 2014). Compound annual growth rate of global internet advertising spending between 2013 and 2018, by category [Graph]. In Statista. Retrieved January 17, 2021, from https://www.statista.com/statistics/307249/global-internet-advertising-spend-cagr-by-category/
PwC. "Compound annual growth rate of global internet advertising spending between 2013 and 2018, by category." Chart. June 4, 2014. Statista. Accessed January 17, 2021. https://www.statista.com/statistics/307249/global-internet-advertising-spend-cagr-by-category/
PwC. (2014). Compound annual growth rate of global internet advertising spending between 2013 and 2018, by category. Statista. Statista Inc.. Accessed: January 17, 2021. https://www.statista.com/statistics/307249/global-internet-advertising-spend-cagr-by-category/
PwC. "Compound Annual Growth Rate of Global Internet Advertising Spending between 2013 and 2018, by Category." Statista, Statista Inc., 4 Jun 2014, https://www.statista.com/statistics/307249/global-internet-advertising-spend-cagr-by-category/
PwC, Compound annual growth rate of global internet advertising spending between 2013 and 2018, by category Statista, https://www.statista.com/statistics/307249/global-internet-advertising-spend-cagr-by-category/ (last visited January 17, 2021)