Adjust the presentation of the statistic and data points.
Share the statistic on social media channels or embed the statistic in your
website using "Embed Code", where available.
Cite this statistic and select one of the following formats: APA, Chicago, Harvard, MLA & Bluebook.
Print the statistic including description and metadata.
Chart type
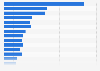
Operating expenses of the Regal Entertainment Group in the United States in 2017, by segment
Share this statistic
You have no right to use this feature.
Make sure to contact us if you are interested in scientific citation.
You can upgrade your account to enable this functionality for all statistics.
This feature is not available with your current account.Request access
Regal Entertainment was acquired by Cineworld Group plc in February 2018, and as such all figures on Regal are now included within Cineworld's reporting.
Figures have been rounded.
Statista has been my savior on several occasions.
The site is easy to maneuver and the data is in a format that can
go right into a report or presentation.
Learn more about how Statista can support your business.
Regal Entertainment Group. (March 1, 2018). Operating expenses of the Regal Entertainment Group in the United States in 2017, by segment (in million U.S. dollars) [Graph]. In Statista. Retrieved September 24, 2025, from https://www.statista.com/statistics/815854/operating-expenses-regal-entertainment-group-by-segment/
Regal Entertainment Group. "Operating expenses of the Regal Entertainment Group in the United States in 2017, by segment (in million U.S. dollars)." Chart. March 1, 2018. Statista. Accessed September 24, 2025. https://www.statista.com/statistics/815854/operating-expenses-regal-entertainment-group-by-segment/
Regal Entertainment Group. (2018). Operating expenses of the Regal Entertainment Group in the United States in 2017, by segment (in million U.S. dollars). Statista. Statista Inc.. Accessed: September 24, 2025. https://www.statista.com/statistics/815854/operating-expenses-regal-entertainment-group-by-segment/
Regal Entertainment Group. "Operating Expenses of The Regal Entertainment Group in The United States in 2017, by Segment (in Million U.S. Dollars)." Statista, Statista Inc., 1 Mar 2018, https://www.statista.com/statistics/815854/operating-expenses-regal-entertainment-group-by-segment/
Regal Entertainment Group, Operating expenses of the Regal Entertainment Group in the United States in 2017, by segment (in million U.S. dollars) Statista, https://www.statista.com/statistics/815854/operating-expenses-regal-entertainment-group-by-segment/ (last visited September 24, 2025)
Operating expenses of the Regal Entertainment Group in the United States in 2017, by segment (in million U.S. dollars) [Graph], Regal Entertainment Group, March 1, 2018. [Online]. Available: https://www.statista.com/statistics/815854/operating-expenses-regal-entertainment-group-by-segment/
Advertisement
Profit from additional features with an Employee Account
Please create an employee account to be able to mark statistics as favorites.
Then you can access your favorite statistics via the star in the header.
Profit from the additional features of your individual account
Currently, you are using a shared account. To use individual functions (e.g., mark statistics as favourites, set
statistic alerts) please log in with your personal account.
If you are an admin, please authenticate by logging in again.