When compared to the tiger, humans are a somewhat ugly creature. A tiger’s fur and markings look like they’ve been especially created by designers; we are naked and somewhat ungainly. The Tiger moves with unparalleled elegance; we totter around on two legs, fighting against gravity. If god has a sense for beauty, he would surely prefer to let humans go extinct than tigers.
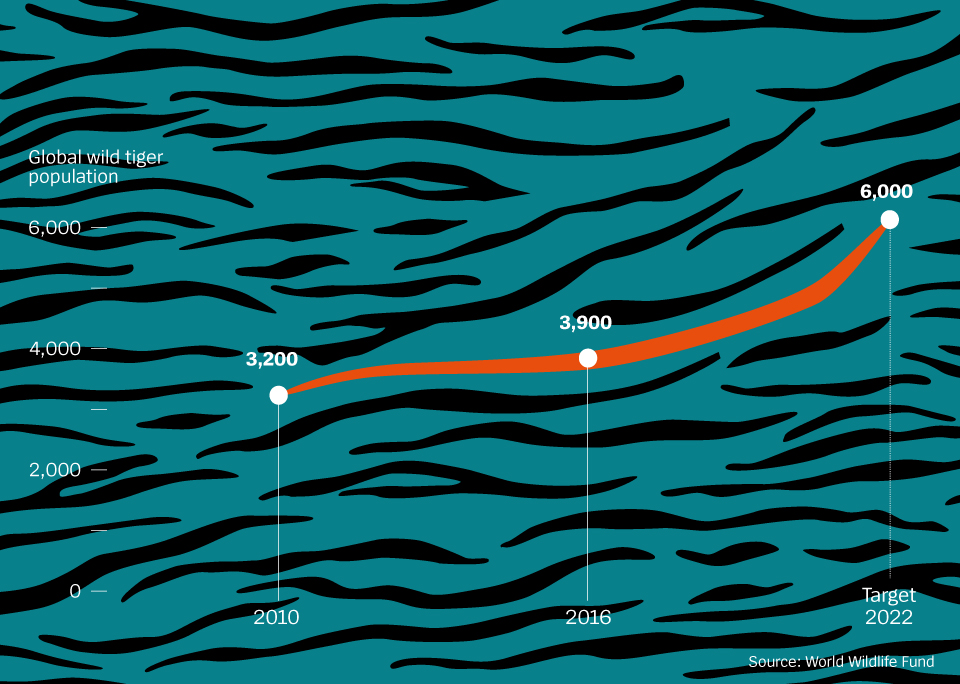
For a long time, it looked the other way round. Recently though, the news has been increasingly positive: since 2010, according to the WWF, the number of wild tigers has “for the first time in over 100 years” risen by just over one fifth. In absolute terms, it doesn’t sound quite so impressive. The population has increased by 700 in this time, making a total of 3,890 wild tigers in the world – although some of this increase is due to the effect of improved survey methods.
3,890 wild tigers really aren’t that many. Yet, the WWF believes that “the decline of the majestic cat can at least be halted”. In 2010, the thirteen “tiger states” (countries in which wild tigers live) agreed to work towards the target of doubling the population by 2022. They are on track.
Even polar bears, an animal synonymous with extinction, are apparently faring okay, with many stock numbers remaining stable. The panda, mascot of the WWF, has seen a population increase of 17 percent over ten years. The best way to fight the extinction of species is to save species. Stay calm and carry on.
This post is brought to you in collaboration with German news magazine DER SPIEGEL. The chart and text were first published by German journalist and author Guido Mingels. It is available as a book here.
As always, our charts are free to use and share, just quote DER SPIEGEL/Statista as the source and include a backlink to the graphic's URL (this page).
The Wild Tigers Are Roaring Again
Endangered Species

Description
This chart shows the global wild tiger population in 2010, 2016 and the target for 2022.


