Skip to main content
Consumer Goods & FMCG
E-Commerce
Economy & Politics
Energy & Environment
Health, Pharma & Medtech
Internet
Media
Technology & Telecommunications
Transportation & Logistics
Travel, Tourism & Hospitality
View all industries
Global data volume growth
Global AI market size
Number of generative AI users worldwide
Global inflation rate
Retail e-commerce sales worldwide
Largest economies worldwide
Biggest social media platforms by users
Global EV market share by manufacturer
International tourist arrivals by world region
Global annual CO₂ emissions
Browse recent statistics
Artificial intelligence (AI) worldwide
TikTok
Nvidia
E-commerce worldwide
Global GDP
Instagram
Apparel market worldwide
Video gaming worldwide
Global renewable energy industry
Influencer marketing worldwide
Browse recent topics
Consumer Trends 2026
Artificial Intelligence: in-depth market analysis
E-commerce challenges
Global economy
TikTok
Luxury goods: in-depth market analysis
Electric vehicles: A global overview
Video gaming worldwide
Travel and tourism trends 2026
Battery recycling worldwide
Browse recent reports
Explore the tool
Explore Classic mode
Advertising & Media
eCommerce
Consumer
Finance
Global Indicators
Health
Industrial
Mobility
Technology
Explore Market Insights
eCommerce Insights
Research AI
Book a demo
All integrations
Developer docs
Explore Statista Connect
Research
Strategy & Consulting
Marketing
Media & PR
Explore AI assistants
Marketing
Research & Development
Strategy
Sales
Find the fact
Tell the story
Win the pitch
Understand the market
Develop your strategy
Academia
Agencies
Consultancies
Consumer goods
Finance
Tech
Research solutions
Strategy consulting
Communication services
Explore Statista+
Statista R
Statista Healthcare
About Statista
First steps & help center
Webinar & training hub
Success stories
Individuals & Small Teams
Businesses & Enterprises
Academia & Government
English
Deutsch
Daily Data
Global stories vividly visualized
Presidential Primary
Jun 26, 2019
This chart shows who voters support if the election were today compared to who voters would support if they could magically make a...
More Information
Financial KPIs
Jun 26, 2019
This chart shows tax on profit as share of turnover in selected European countries in 2019, by company size.
More Information
Financial KPIs
Jun 26, 2019
This chart shows EBIT as share of turnover in selected European countries from 2005 to 2019.
More Information
Demographics
Jun 26, 2019
This chart shows year on year change of the UK population from 1953 to 2018.
More Information
Turkey
Jun 26, 2019
This chart shows the mayor's party in Turkish cities before and after the local elections.
More Information
Video Piracy
Jun 26, 2019
This chart shows the estimated total number of views of digital pirated content in 2017 (billions).
More Information
Survey
Jun 26, 2019
Share of UK parents saying they have experienced certain damge to the home caused by their toddler(s) in 2019.
More Information
H-1B Visas
Jun 26, 2019
This chart shows the denial rate of H-1B petitions for initial employment in the U.S. (selected companies).
More Information
Global Demographics
Jun 25, 2019
This chart shows the median age by region, comparing 1950 to 2100.
More Information
Electrical Appliances
Jun 25, 2019
This chart shows the average predicted reliability score (100 = most reliable)
More Information
Banking
Jun 25, 2019
This chart shows the countries with the highest share of adults (15+) without a bank account in 2017.
More Information
Royal Family
Jun 25, 2019
This chart shows the most expensive journeys conducted by members of the royal family (2018-2019).
More Information
Gaming
Jun 25, 2019
This chart shows the public companies with the most revenue from games in 2018.
More Information
United Kingdom
Jun 25, 2019
This chart shows the share of people in the UK in top professions/jobs that attended an independent school in 2019.
More Information
Rent
Jun 25, 2019
This chart shows the housing wage vs median hourly wage of jobs with the largest projected growth.
More Information
Worldwide Vices
Jun 24, 2019
This chart shows the percentage that agree that using the following in moderation is morally acceptable.
More Information
Photography Timeline
Jun 24, 2019
This chart shows the timeline of the camera from the early 1500's to present day.
More Information
Turkey
Jun 24, 2019
This chart shows the results of the March and re-run June Istanbul mayoral elections.
More Information
Piracy
Jun 24, 2019
This chart shows total incidents of piracy and robbery by region.
More Information
App Usage
Jun 21, 2019
This chart shows the smartphone app usage by application type in the U.S. 2019.
More Information
iPhone Users
Jun 21, 2019
This chart shows the market reach of the most popular Apple iOS app categories in the United States
More Information
Digital Cameras
Jun 21, 2019
This chart shows the percent of generation Z respondents that own or use a digital camera.
More Information
Mobile Traffic
Jun 21, 2019
This chart shows the number of unique visitors to websites of select U.S. magazine brands (in millions of visitors).
More Information
App Stores
Jun 21, 2019
This chart shows the average gross revenue of the top 100 app publishers, by app store.
More Information
FMCG E-Commerce
Jun 21, 2019
This chart shows the e-commerce share of FMCG sales in selected countries.
More Information
U.S. Iran Tensions
Jun 21, 2019
This chart shows the share of Americans who support or oppose military action against Iran.
More Information
Consumer Prices
Jun 21, 2019
This chart shows the rise of the rural/urban consumer price index in India from 2016 to May 2019.
More Information
Tourism
Jun 21, 2019
This chart shows the average amount of money spent per night and the total spent by different groups visiting Sydney overnight,
More Information
Climate Change
Jun 21, 2019
This chart shows the estimated expected cost of seawall construction in U.S. states up to 2040.
More Information
Internet Users
Jun 20, 2019
This chart shows the share of respondents who do not have high speed internet at home, by reason.
More Information
Media Consumption
Jun 20, 2019
This chart shows the percentage of people in different countries who said they were checking the news more than once a day.
More Information
Global Politics
Jun 20, 2019
This chart shows the share of people saying selected countries mostly use their influence for bad around the world in 2019.
More Information
Energy Mix
Jun 20, 2019
This chart shows past and planned shares of electricity generation in South Korea.
More Information
Remittance Costs
Jun 20, 2019
This chart shows the average cost of a $200 remittance to the following world regions in Q4 2018.
More Information
Plastic Waste
Jun 20, 2019
This chart shows trade flows of the largest exporters of plastic waste in the world.
More Information
U.S. Iran Tensions
Jun 20, 2019
This chart shows the unit cost of selected U.S. military drones in 2019.
More Information
Health
Jun 20, 2019
This chart shows the most commonly cited reasons for teens in Great Britain for trying an e-cigarette in 2019.
More Information
New Ranking
Jun 20, 2019
This chart shows the CEOs with the largest share of UK employees that approve of their performance in 2019.
More Information
Tech Industry
Jun 19, 2019
This chart shows the brand value of the top industries in 2019 (in billion USD).
More Information
New Ranking
Jun 19, 2019
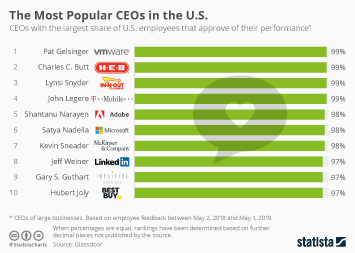
This chart shows the CEOs with the largest share of U.S. employees that approve of their performance in 2019.
More Information
Vaccines
Jun 19, 2019
This chart shows the countries where most people are skeptical of vaccines (neither agree nor disagree that vaccines are safe).
More Information
Science
Jun 19, 2019
This chart compares attitudes towards vaccinations in France and the UK.
More Information
Global threats
Jun 19, 2019
This graphic shows the most commonly cited major threat by respondents for 26 countries.
More Information
Slack
Jun 19, 2019
This chart shows daily active and paid Slack users.
More Information
Health
Jun 19, 2019
This chart shows the share strongly or somewhat disagreeing that vaccines are safe in 2019.
More Information
Personal Information
Jun 19, 2019
This chart shows the median price U.S. adults would charge a company for personal information.
More Information
Salary
Jun 19, 2019
This chart shows the difference between median annual early career salaries and average salary expectations of college undergraduates...
More Information
Refugees
Jun 19, 2019
This chart shows the number of refugees per 1,000 inhabitants in mid-2016.
More Information
Sponsored Post
Jun 19, 2019
This chart ranks the international outlook of universitites in Germany.
More Information
Brexit
Jun 19, 2019
This chart shows the share of Conservatives who would accept the following for Brexit to take place
More Information
Selfie Usage
Jun 18, 2019
This chart shows the percent of U.S. adults who agree with Disney's ban on selfie sticks.
More Information
Malaria Elimination
Jun 18, 2019
This chart shows local and imported malaria cases in China between 2010 and 2017.
More Information
Economic Wellbeing in the United States
Jun 18, 2019
This chart shows the longterm growth of real mean and median family income in the U.S.
More Information
Racism in Football
Jun 18, 2019
Football supporter arrests where racism was an aggravating factor in the UK.
More Information
University Enrollment
Jun 18, 2019
This chart shows enrollment numbers of university student in Australia between 1989 and 2017.
More Information
Parcels
Jun 18, 2019
This chart shows the average number of parcels received per person in selected countries.
More Information
UK Politics
Jun 18, 2019
This chart shows the share of Conservative Party members saying leadrship candidates would make a good leader.
More Information
Selfies
Jun 17, 2019
This chart shows the percent who think it is acceptable or unacceptable to take a selfie in certain circumstances.
More Information
Statista Archive
Jun 17, 2019
This chart reveals the major wars/conquests in modern history with the highest average deaths per year.
More Information
Innovation
Jun 17, 2019
This chart shows European Innovation Scoreboard rankings in 2019 (150 = most innovative).
More Information
Meat Alternatives
Jun 17, 2019
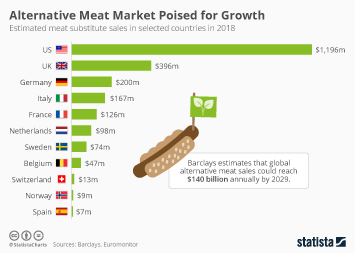
This chart shows estimated meat substitute sales in selected countries in 2018.
More Information
Statista Study
Jun 17, 2019
This chart shows beer sales revenue per capita in selected countries in 2018.
More Information
Marijuana
Jun 17, 2019
This chart shows U.S. marijuana supporters/opponents views on marijuana legalization.
More Information
News Topics
Jun 14, 2019
This chart shows the share of people following current topics and what they want to hear more about.
More Information
Political Polarization
Jun 14, 2019
This chart shows the share of respondents that trust most news most of the time by partisanship.
More Information
Prepaid Phone Subscriptions
Jun 14, 2019
This chart shows the number of AT&T wireless subscribers by subscription type (in thousands).
More Information
Connected Devices
Jun 14, 2019
This chart shows the number of worldwide AT&T connected device subscribers from 2009 to 2019 (in 1,000's).
More Information
U.S. Holidays
Jun 14, 2019
This chart shows the percent of U.S. parents that would most likely want the following for Mother's and Father's Day.
More Information
Smartphone News Use
Jun 14, 2019
This chart shows the proportion of smartphone-first users that used each for first contact with news.
More Information
Media Literacy
Jun 14, 2019
This chart shows the media literacy rank across European countries.
More Information
Quality of Life
Jun 14, 2019
This chart shows the average rank for indicators of family-friendly policies of selected European countries.
More Information
NBA
Jun 14, 2019
This chart shows the season finishes of the Toronto Raptors in the NBA since 2008-09.
More Information
National Bourbon Day
Jun 14, 2019
This chart shows facts and figures on American bourbon whiskey.
More Information
Cruise Ship Pollution
Jun 14, 2019
This chart shows SOx emissions from cruise ships and cars in European port cities in 2017 (kg).
More Information
Greenhouse Gases
Jun 14, 2019
This chart shows estimated carbon dioxide emissions in 2017 (million tonnes).
More Information
EV Sales
Jun 13, 2019
This chart shows plug-in electric vehicle sales by car type from May 2019.
More Information
Financial Stability
Jun 13, 2019
This chart shows the payment methods used by Americans to cover a hypothetical expense.
More Information
UK politics
Jun 13, 2019
This chart shows the number of Conservative MPs backing leadership candidates in the first round ballot.
More Information
Athlete Endorsement Earnings
Jun 13, 2019
This chart shows which athletes had the highest endorsement earnings between June 2018 and June 2019.
More Information
Wages
Jun 13, 2019
This chart shows average hourly wages for production and nonsupervisory employees in the U.S. in current and in constant May 2019 dollars.
More Information
Marijuana
Jun 13, 2019
This chart shows total state revenue from marijuana in Colorado by year.
More Information
Fake News
Jun 13, 2019
This chart shows the share concerned about what is real and fake on the internet when it comes to news in 2019.
More Information
Digital Media Use
Jun 12, 2019
This chart shows the daily hours spent with digital media in the U.S. per adult user, 2008 to 2018.
More Information
New Research
Jun 12, 2019
This chart shows the number of known extinctions since 1750, by species type.
More Information
Big Data
Jun 12, 2019
This chart shows the global big data and business analytics revenue between 2015 and 2022.
More Information
Energy Cost
Jun 12, 2019
This chart shows the price increase of household electricity and household gas on the Australian consumer price index from 1990 until...
More Information
Global Peace Index
Jun 12, 2019
This chart shows countries ranked by state of peace in 2018 (1=most peaceful, 5=least peaceful).
More Information
Immigration
Jun 12, 2019
This chart shows companies attitudes toward the new labor immigration law in Japan in May 2019.
More Information
2019 FIFA Women's World Cup
Jun 12, 2019
This chart shows total prize money awarded at soccer World Cups by FIFA.
More Information
Alcohol
Jun 11, 2019
This chart compares key figures for the brewing company Brewdog PLC in 2010 and 2018.
More Information
94
/
161
Contact
Get in touch with us. We are happy to help.
Do you still have questions?
Feel free to contact us anytime using our
contact form
or visit our
FAQ page
.
Your contact to the Infographics Newsroom
Felix Richter
Data Journalist
felix.richter@statista.com
+49 (40) 284 841 557