Skip to main content
Consumer Goods & FMCG
E-Commerce
Economy & Politics
Energy & Environment
Health, Pharma & Medtech
Internet
Media
Technology & Telecommunications
Transportation & Logistics
Travel, Tourism & Hospitality
View all industries
Global data volume growth
Global AI market size
Number of generative AI users worldwide
Global inflation rate
Retail e-commerce sales worldwide
Largest economies worldwide
Biggest social media platforms by users
Global EV market share by manufacturer
International tourist arrivals by world region
Global annual CO₂ emissions
Browse recent statistics
Artificial intelligence (AI) worldwide
TikTok
Nvidia
E-commerce worldwide
Global GDP
Instagram
Apparel market worldwide
Video gaming worldwide
Global renewable energy industry
Influencer marketing worldwide
Browse recent topics
Consumer Trends 2026
Artificial Intelligence: in-depth market analysis
E-commerce challenges
Global economy
TikTok
Luxury goods: in-depth market analysis
Electric vehicles: A global overview
Video gaming worldwide
Travel and tourism trends 2026
Battery recycling worldwide
Browse recent reports
Explore the tool
Explore Classic mode
Advertising & Media
eCommerce
Consumer
Finance
Global Indicators
Health
Industrial
Mobility
Technology
Explore Market Insights
eCommerce Insights
Research AI
Book a demo
All integrations
Developer docs
Explore Statista Connect
Research
Strategy & Consulting
Marketing
Media & PR
Explore AI assistants
Marketing
Research & Development
Strategy
Sales
Find the fact
Tell the story
Win the pitch
Understand the market
Develop your strategy
Academia
Agencies
Consultancies
Consumer goods
Finance
Tech
Research solutions
Strategy consulting
Communication services
Explore Statista+
Statista R
Statista Healthcare
About Statista
First steps & help center
Webinar & training hub
Success stories
Individuals & Small Teams
Businesses & Enterprises
Academia & Government
English
Deutsch
Daily Data
Infographics on the topic "inflation"
Second hand shopping
Mar 29, 2023
This chart shows the most popular second hand items to buy in the United States in 2022.
More Information
Debt to China
Mar 29, 2023
This chart shows countries using emergency loans from China, by number of years utilized between 2000-2021.
More Information
Economy
Mar 23, 2023
This chart shows the interest rate set by the Bank of England from Jan. 2007 to Mar. 2023.
More Information
Investments
Mar 10, 2023
This chart shows the increase in value of select luxury investment asset classes in 2022.
More Information
Assets
Mar 6, 2023
This chart shows the average 10-year price change of luxury investment types as of 2022.
More Information
Valentine's Day
Feb 14, 2023
This chart shows how inflation has impacted Valentine's Day gifts this year.
More Information
Real Wages
Feb 9, 2023
This chart shows average full-time real wages before tax in selected countries in 1990 and 2021 (in U.S. dollars/PPP).
More Information
NHS strikes
Feb 8, 2023
This chart shows the percentage of forieign trained doctors in selected countries.
More Information
Inflation
Jan 12, 2023
This chart shows the annual inflation rate in the United States (1990-2022).
More Information
Jobs Crisis
Jan 9, 2023
This chart shows the change in total nonfarm employment in the U.S. between February 2020 and December 2022, by industry.
More Information
Tech Stocks in 2022
Jan 2, 2023
This chart shows the stock price change of the world's largest tech companies in 2020, 2021 and 2022.
More Information
Lula Inauguration
Jan 2, 2023
This chart shows the key issues that Urban Brazilian respondents find the most important.
More Information
Sponsored post by Booking.com
Jan 2, 2023
This infographic shows the number of jobs generated by online travel platforms in the EU from 2019 to 2021.
More Information
Tesla
Dec 21, 2022
This chart compares Tesla's market capitalization to the combined market cap of major car manufacturers.
More Information
Christmas
Dec 16, 2022
The average cost of a Christmas dinner for four people in the UK in 2022.
More Information
Economy
Dec 13, 2022
This chart shows the change in real wages per employee in selected OECD countries in Q3 2022 vs. Q3 2021.
More Information
Christmas attitudes
Dec 9, 2022
This chart shows the share of U.S. respondents agreeing with selected statements about the holiday season.
More Information
Christmas
Dec 7, 2022
This chart shows where price hikes are causing more stress this Christmas.
More Information
Real Wages
Dec 5, 2022
This chart shows global average real wage growth since 2006.
More Information
E-Commerce
Nov 28, 2022
This chart shows estimated online holiday season spending in the United States in 2022, by event.
More Information
Thanksgiving
Nov 24, 2022
This chart shows the average price of a ten-person Thanksgiving dinner in the U.S. from 1990 to 2022.
More Information
Diabates
Nov 14, 2022
This chart shows the countries with the highest revenue from diabetes drug sales in 2021.
More Information
Singles' Day
Nov 14, 2022
This chart shows the gross merchandise volume for Alibaba on Singles' Day in China (in billion U.S. dollars).
More Information
2022 U.S. Midterm Elections
Nov 10, 2022
This chart shows the most important issues for voters in the 2022 midterm elections.
More Information
GAMAM two years into the pandemic
Nov 10, 2022
This chart shows revenue growth for selected tech companies in the first nine months of 2021.
More Information
Stock Market
Nov 9, 2022
This chart shows how the S&P 500 has historically performed in the 12 months before and after midterm elections.
More Information
2022 Midterms
Nov 8, 2022
This chart shows share of voters who said that they considered abortion "a lot" when making their decision in the 2022 midterms.
More Information
Household Finances
Nov 7, 2022
This chart shows the personal saving rate in the United States.
More Information
Consumer Spending
Nov 7, 2022
This chart shows real personal consumption expenditures in the U.S. (seasonally adjusted annual rates).
More Information
Starbucks
Nov 7, 2022
More Information
Chinese Trade
Nov 7, 2022
This chart shows the monthly import and export growth rate for China between 2019 and 2022.
More Information
Stress Awareness Month
Nov 7, 2022
This chart shows the things causing most stress for Americans in 2022.
More Information
Big Tech
Oct 28, 2022
This chart shows the change in market capitalization of selected tech companies between Oct. 25 and Oct. 28.
More Information
Oil & Gas
Oct 19, 2022
This chart shows the number of global oil and gas lease rounds, by year of award.
More Information
inflation
Oct 13, 2022
This chart shows which issues people are most worried about globally as of September 2022.
More Information
India Trade
Oct 5, 2022
This chart shows the monthly overall trade deficit in India (in billion U.S. dollars).
More Information
Box Office Revenue
Oct 5, 2022
This chart shows U.S. domestic box office revenue by movie franchise (in billion U.S. dollars).
More Information
Economy
Sep 15, 2022
This chart shows the GDP of India and the United Kingdom from 1980 to 2027.
More Information
cost of living crisis
Sep 15, 2022
This chart shows a break down of the cost of living for one working adult in 2022.
More Information
cost of living crisis
Sep 15, 2022
This chart shows how the cost of living crisis is imacting different groups in 2022.
More Information
Inflation in the U.S.
Sep 14, 2022
This chart shows the share of U.S. adults saying that recent price increases have caused financial hardship for them.
More Information
Russia-Ukraine War
Sep 9, 2022
This chart shows the share of respondents thinking Russia/Ukraine/neither will win the war.
More Information
Interest Rates
Sep 9, 2022
This chart shows the level of central bank interest rates as of September 8, 2022, and occurrence of raise or cut in the current year.
More Information
Restaurant Sales
Sep 2, 2022
This chart shows the year-over-year change in monthly restaurant sales in the United States (in percent).
More Information
Cost of Living
Aug 31, 2022
This chart shows a timeline of the default tariff price cap for dual fuel direct debit customers in the UK.
More Information
Semiconductor Manufacturing
Aug 19, 2022
This chart shows the annual revenue of the leading semiconductor foundries.
More Information
energy crisis
Aug 17, 2022
This chart shows the energy inflation rates in the EU since 2018.
More Information
Kenya presidential election
Aug 16, 2022
This chart shows the most important issues in Kenya, according to a survey in 2021.
More Information
Oil market
Aug 15, 2022
This chart shows how Saudi Aramco's oil has increased between 2020 and 2022.
More Information
Internet
Aug 15, 2022
This chart shows global e-commerce revenue from 2019 to 2021 and forecasts for 2022.
More Information
Build Back Better Agenda
Aug 12, 2022
This chart shows the components of the Inflation Reduction Act and the proposed human infrastructure bill of 2021 (in billion U.S....
More Information
Electric vehicles
Aug 11, 2022
This chart shows the share of U.S. adults saying they're unlikely to buy an electric vehicle as their next car for the following reasons.
More Information
Inflation
Aug 11, 2022
This chart shows ehre Americans plan to cut back to save money in face of inflation and high energy prices.
More Information
New Cars
Aug 10, 2022
This chart shows the estimated average price of new cars sold in the U.S. in June 2022, by category.
More Information
Recession
Aug 9, 2022
This chart shows real GDP growth in the U.S. in Q1/Q2 of 2022 and change in other economic indicators (June vs. May).
More Information
Drug Prices
Aug 9, 2022
Percentage by which the prices of U.S. prescription drugs surpass those in other selected countries.
More Information
economy
Aug 9, 2022
More Information
Climate
Aug 9, 2022
This chart shows the annual change in net U.S. GHG emissions due to the Inflation Reduction Act of 2022 relative to current policy...
More Information
U.S. Politics
Aug 3, 2022
This chart shows the problems that Americans think are the most important facing their country in July 2022.
More Information
Inflation
Jul 27, 2022
This chart shows the share of U.S. adults concerned about being able to afford certain goods and services in the face of rising prices.
More Information
Amazon
Jul 26, 2022
This chart shows the growth of Amazon's shipping and fulfillment costs.
More Information
economic downturn
Jul 22, 2022
This chart shows the change in value of Latin American currencies over time in 2022.
More Information
sri lanka's economic crisis
Jul 14, 2022
This chart shows Sri Lankans' confidence ratings on the government, country and economy in 2022.
More Information
Inflation
Jul 13, 2022
This chart shows the year-over-year change in the price of selected items on the Consumer Price Index (June 2021-June 2022).
More Information
Exchange Rates
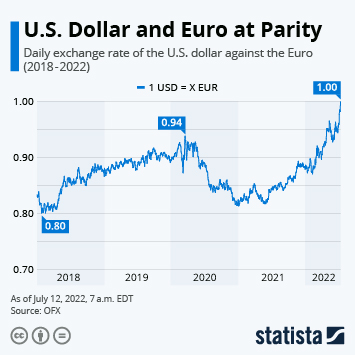
Jul 12, 2022
This chart shows the daily exchange rate of the U.S. dollar against the Euro (2018-2022).
More Information
july 4
Jul 4, 2022
This chart shows the number of flights that were delayed or canceled over the July 4 weekend, 2022.
More Information
Sanctions against Russia
Jun 30, 2022
This chart shows how willing EU citizens are to accept the consequences of sanctions against Russia for example in the form of rising...
More Information
Global GDP growth
Jun 30, 2022
This chart shows the Global GDP growth projections for 2022 (pre- and post-war outbreak).
More Information
Anger
Jun 24, 2022
This chart shows the share of the population that experienced a lot of anger yesterday (2021).
More Information
Central Bank rates
Jun 20, 2022
This chart shows the date of the most recent Asian central bank rate hikes and countries where rates stayed the same/were cut (as of...
More Information
Americans' Top Concerns
Jun 20, 2022
This chart shows which issues Americans think need to be addressed most urgently in their country.
More Information
Inflation Outpaces Wages
Jun 16, 2022
This chart shows the year-over-year change in consumer prices, real and nominal hourly earnings in the UK.
More Information
Economy
Jun 9, 2022
This chart shows the y-o-y inflation rates in 2022 in selected countries (projections as of June 2022).
More Information
NFTs
Jun 3, 2022
This chart shows where the most NFT users lived in 2021, by country.
More Information
Inflation
Jun 1, 2022
This chart shows the monthly reading of the consumer price index for selected countries.
More Information
Economics
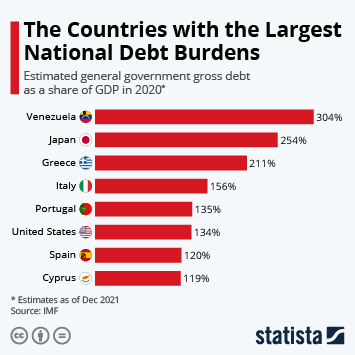
May 20, 2022
This chart shows the countries with the largest estimated general government gross debt as a share of GDP in 2020.
More Information
Inflation
May 19, 2022
This chart shows the year-over-year change in the price of selected ingredients of a hamburger (April 2021-April 2022).
More Information
2022 Midterms
May 18, 2022
This chart shows survey responses to the question: "Which political party's views are closer to your own on the following issues?"
More Information
Cryptocurrencies
May 13, 2022
This infographic charts the daily price of Bitcoin from 2017 to 2022.
More Information
Friday the 13th
May 13, 2022
This chart shows the highest-grossing Friday the 13th franchise entries.
More Information
Economy
May 10, 2022
This chart shows the share of U.S. adults that were very/moderately worried about their finances in 2019 and 2022.
More Information
Stock Market
May 2, 2022
This chart compares the performance of major U.S. stock market indices in April 2022.
More Information
Environment
Apr 14, 2022
This chart shows the share of adults that say it is important to them that their country shifts away from fossil fuels in 2021.
More Information
Economics
Apr 13, 2022
Year-over-year change in the Consumer Price Index in Turkey
More Information
Recessions & inflation
Apr 7, 2022
This chart shows the peak unemployment rates during recessions in the U.S. since World War II.
More Information
Commodities
Mar 9, 2022
This chart ranks the world's largest wheat exporters in 2020.
More Information
Stock market
Feb 24, 2022
This chart shows the year-to-date development of biggest U.S. stock market indices.
More Information
S&P 500
Jan 7, 2022
This chart shows the best and worst performing sectors on the S&P 500 in 2021.
More Information
Box Office
Dec 20, 2021
This chart shows domestic weekend box office sales since 2019.
More Information
Currency Markets
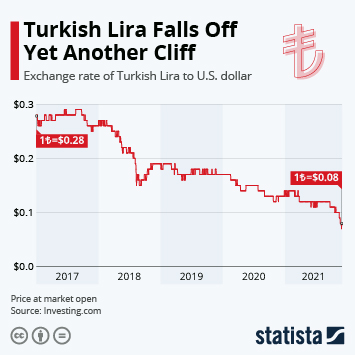
Dec 1, 2021
This chart shows the exchange rate for Lira into U.S. dollar in 2017 to 2021.
More Information
5
/
6
Contact
Get in touch with us. We are happy to help.
Do you still have questions?
Feel free to contact us anytime using our
contact form
or visit our
FAQ page
.
Your contact to the Infographics Newsroom
Felix Richter
Data Journalist
felix.richter@statista.com
+49 (40) 284 841 557