Information on when we delete personal data, the countries where we save data (e.g., US, EU, Singapore), and the companies we collaborate with can be found in our privacy statement.
Our customers work more efficiently and benefit from:
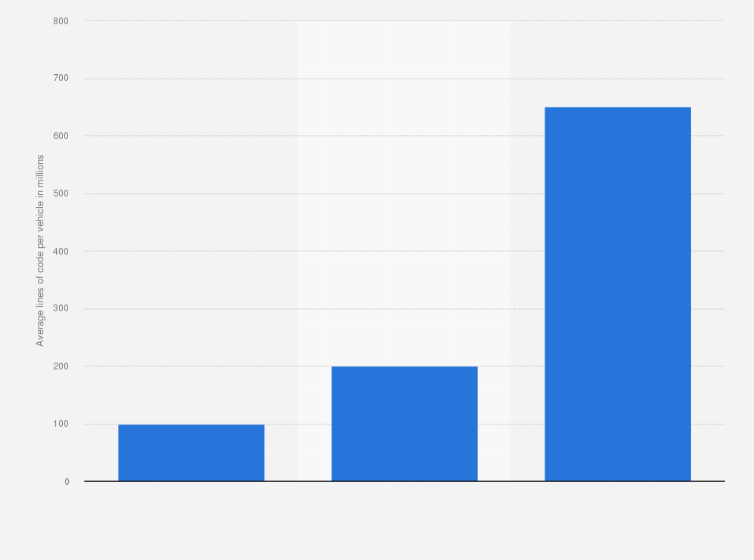
Between 2015 and 2020, the average amount of lines of code per vehicle
*******
Log in or register to access precise data.
from
***
Log in or register to access precise data.
to
***
Log in or register to access precise data.
millions. As a result of the rise of electric and autonomous vehicles, software will continue to be a significant part of automotive production in the following years. In 2025, an average vehicle is expected to have
Adjust the presentation of the statistic and data points.
Share the statistic on social media channels or embed the statistic in your
website using "Embed Code", where available.
Cite this statistic and select one of the following formats: APA, Chicago, Harvard, MLA & Bluebook.
Print the statistic including description and metadata.
Chart type
Average number of lines of codes per vehicle globally in 2015 and 2020, with a forecast for 2025
Share this statistic
You have no right to use this feature.
Make sure to contact us if you are interested in scientific citation.
You can upgrade your account to enable this functionality for all statistics.
This feature is not available with your current account.Request access
Learn more about how Statista can support your business.
Goldman Sachs. (November 8, 2022). Average number of lines of codes per vehicle globally in 2015 and 2020, with a forecast for 2025 (in millions) [Graph]. In Statista. Retrieved November 16, 2025, from https://www.statista.com/statistics/1370978/automotive-software-average-lines-of-codes-per-vehicle-globally/
Goldman Sachs. "Average number of lines of codes per vehicle globally in 2015 and 2020, with a forecast for 2025 (in millions)." Chart. November 8, 2022. Statista. Accessed November 16, 2025. https://www.statista.com/statistics/1370978/automotive-software-average-lines-of-codes-per-vehicle-globally/
Goldman Sachs. (2022). Average number of lines of codes per vehicle globally in 2015 and 2020, with a forecast for 2025 (in millions). Statista. Statista Inc.. Accessed: November 16, 2025. https://www.statista.com/statistics/1370978/automotive-software-average-lines-of-codes-per-vehicle-globally/
Goldman Sachs. "Average Number of Lines of Codes per Vehicle Globally in 2015 and 2020, with a Forecast for 2025 (in Millions)." Statista, Statista Inc., 8 Nov 2022, https://www.statista.com/statistics/1370978/automotive-software-average-lines-of-codes-per-vehicle-globally/
Goldman Sachs, Average number of lines of codes per vehicle globally in 2015 and 2020, with a forecast for 2025 (in millions) Statista, https://www.statista.com/statistics/1370978/automotive-software-average-lines-of-codes-per-vehicle-globally/ (last visited November 16, 2025)
Average number of lines of codes per vehicle globally in 2015 and 2020, with a forecast for 2025 (in millions) [Graph], Goldman Sachs, November 8, 2022. [Online]. Available: https://www.statista.com/statistics/1370978/automotive-software-average-lines-of-codes-per-vehicle-globally/
Advertisement
Profit from additional features with an Employee Account
Please create an employee account to be able to mark statistics as favorites.
Then you can access your favorite statistics via the star in the header.
Profit from the additional features of your individual account
Currently, you are using a shared account. To use individual functions (e.g., mark statistics as favourites, set
statistic alerts) please log in with your personal account.
If you are an admin, please authenticate by logging in again.