Information on when we delete personal data, the countries where we save data (e.g., US, EU, Singapore), and the companies we collaborate with can be found in our privacy statement.
Our customers work more efficiently and benefit from:
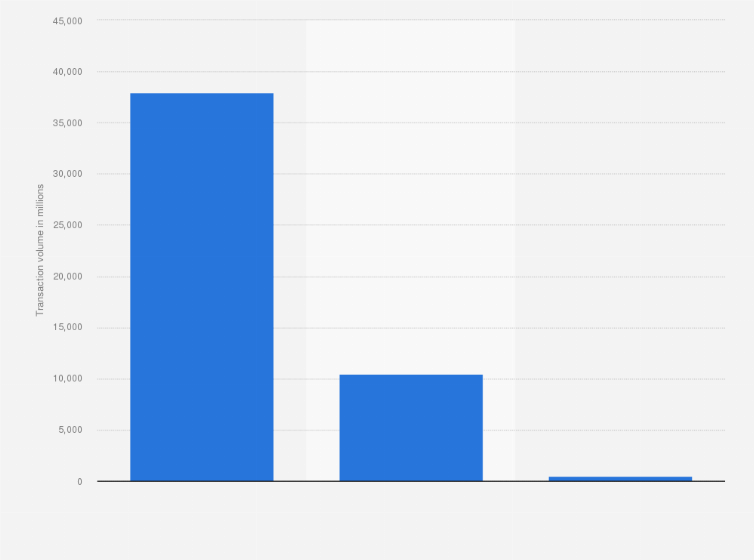
billion mobile money IPS transactions were registered across the continent. Cross-domain IPS counted
****
Log in or register to access precise data.
billion. The latter provides access for banks and non-banks and supports transactions made from both bank and mobile money accounts. Instant payment systems are used across the different African regions.
Adjust the presentation of the statistic and data points.
Share the statistic on social media channels or embed the statistic in your
website using "Embed Code", where available.
Cite this statistic and select one of the following formats: APA, Chicago, Harvard, MLA & Bluebook.
Print the statistic including description and metadata.
Chart type
Volume of instant payment transactions (IPS) in Africa as of 2023, by system
Share this statistic
You have no right to use this feature.
Make sure to contact us if you are interested in scientific citation.
You can upgrade your account to enable this functionality for all statistics.
This feature is not available with your current account.Request access
The source defines Instant Payment Systems (IPS) as that which allow digital push payments through set procedures, making final funds available to the payee in the nearest real-time.
The source reports, that there is missing data from 10 IPS around Africa. Therefore, the volume could be underestimated.
Learn more about how Statista can support your business.
AfricaNenda Foundation. (November 22, 2024). Volume of instant payment transactions (IPS) in Africa as of 2023, by system (in millions) [Graph]. In Statista. Retrieved November 16, 2025, from https://www.statista.com/statistics/1461336/volume-of-instant-payment-transactions-in-africa-by-system/
AfricaNenda Foundation. "Volume of instant payment transactions (IPS) in Africa as of 2023, by system (in millions)." Chart. November 22, 2024. Statista. Accessed November 16, 2025. https://www.statista.com/statistics/1461336/volume-of-instant-payment-transactions-in-africa-by-system/
AfricaNenda Foundation. (2024). Volume of instant payment transactions (IPS) in Africa as of 2023, by system (in millions). Statista. Statista Inc.. Accessed: November 16, 2025. https://www.statista.com/statistics/1461336/volume-of-instant-payment-transactions-in-africa-by-system/
AfricaNenda Foundation. "Volume of Instant Payment Transactions (Ips) in Africa as of 2023, by System (in Millions)." Statista, Statista Inc., 22 Nov 2024, https://www.statista.com/statistics/1461336/volume-of-instant-payment-transactions-in-africa-by-system/
AfricaNenda Foundation, Volume of instant payment transactions (IPS) in Africa as of 2023, by system (in millions) Statista, https://www.statista.com/statistics/1461336/volume-of-instant-payment-transactions-in-africa-by-system/ (last visited November 16, 2025)
Volume of instant payment transactions (IPS) in Africa as of 2023, by system (in millions) [Graph], AfricaNenda Foundation, November 22, 2024. [Online]. Available: https://www.statista.com/statistics/1461336/volume-of-instant-payment-transactions-in-africa-by-system/
Advertisement
Profit from additional features with an Employee Account
Please create an employee account to be able to mark statistics as favorites.
Then you can access your favorite statistics via the star in the header.
Profit from the additional features of your individual account
Currently, you are using a shared account. To use individual functions (e.g., mark statistics as favourites, set
statistic alerts) please log in with your personal account.
If you are an admin, please authenticate by logging in again.