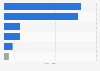
This statistic shows the global demand for palladium for dental applications by region from 2013 to 2018. In 2018, the demand for palladium for the dental industry reached 114,000 ounces in North America.
Global palladium demand for dental applications by region from 2013 to 2018 (in 1,000 ounces)
Basic Account
Get to know the platform
You only have access to basic statistics.
This statistic is not included in your account.
Starter Account
The ideal entry-level account for individual users
- Instant access to 1m statistics
- Download in XLS, PDF & PNG format
- Detailed references
$199 USD / Month *
Professional Account
Full access
Business Solutions including all features.
* Prices do not include sales tax.
Other statistics that may interest you Statistics on
About the industry
9
- Premium Statistic Global palladium demand 2021-2023, by region
- Premium Statistic Worldwide supply of palladium 2013-2023
- Premium Statistic Worldwide chemical demand for platinum and palladium by region 2018
- Premium Statistic Worldwide petroleum demand for platinum by region 2013-2018
- Premium Statistic Worldwide supply of platinum 2005-2023
- Premium Statistic Global demand for platinum 2005-2023
- Premium Statistic Worldwide demand for platinum by region 2019-2023
- Premium Statistic Average cost of platinum production by region 2013-2018
- Premium Statistic Cash costs plus capex platinum production by region 2016-2018
About the region
10
- Premium Statistic Worldwide glass demand for platinum by region 2013-2018
- Basic Statistic Annual price of platinum by major currency 2013-2014
- Premium Statistic Global palladium demand volume 2014-2023
- Premium Statistic Global mine production of platinum-group metals 2010-2022
- Premium Statistic Global leading exporting countries of palladium 2022
- Premium Statistic Share of palladium production worldwide 2022, by mining company
- Premium Statistic Rio Tinto's gold and silver production 2010-2023
- Basic Statistic Palladium mine production in the U.S. 2010-2023
- Basic Statistic Nornickel's palladium production 2010-2023
- Premium Statistic Norilsk Nickel's platinum production 2010-2022
Selected statistics
5
- Premium Statistic Agnico-Eagle Mines' gold reserves 2000-2022
- Premium Statistic Agnico-Eagle Mines' average gold price realized 2010-2022
- Basic Statistic Annual silver production of Coeur Mining 2010-2021
- Premium Statistic Global silver supply distribution by source 2014
- Basic Statistic Leading global palladium consuming regions2010
Other regions
10
- Premium Statistic Value of U.S. mine production of platinum 2010-2022
- Premium Statistic Share of gold production in Canada 2022, by region
- Premium Statistic Mexico: silver mine production in ounces 2012-2022
- Basic Statistic Palladium production in South Africa 2010-2023
- Premium Statistic North American palladium production 2010-2019
- Premium Statistic North American platinum production 2010-2019
- Premium Statistic China's lead production 2010-2023
- Premium Statistic Value of precious metal exports from Russia monthly 2021-2023
- Premium Statistic Turkey: monthly value of precious metal exports 2017-2018
- Premium Statistic Germany: monthly value of precious metal imports 2017
Related statistics
10
- Premium Statistic U.S. platinum refinery production volume 2010-2022
- Basic Statistic U.S. platinum refinery production value 2010-2021
- Premium Statistic U.S. mine production of platinum in kilograms 2010-2022
- Premium Statistic U.S. import volume of platinum 2014-2022
- Basic Statistic U.S. refined platinum export volume 2010-2022
- Premium Statistic Silver reserves in Canada 1980-2019
- Premium Statistic Gold reserves in Canada 1980-2019
- Premium Statistic Mine closures in Canada by mine type 2006-2015
- Premium Statistic South Africa's platinum production volume 2010-2022
- Premium Statistic Platinum mine production in Canada 2010-2022
Further related statistics
10
- Rio Tinto's aluminum and copper production 2010-2023
- Number of Rio Tinto's employees 2010-2023
- Freeport-McMoRan's copper production 2010-2023
- Molycorp's revenue 2008-2014
- Rio Tinto's net income 2001-2023
- Comparison of cobalt consumption in the U.S. 2010-2023
- Iron ore prices 2000-2022
- Thermal coal prices 2013-2022
- Rare earths demand growth rates for specific industry sectors 2010-2015
- Rio Tinto's uranium production 2010-2023
Further Content: You might find this interesting as well
Statistics
- Rio Tinto's aluminum and copper production 2010-2023
- Number of Rio Tinto's employees 2010-2023
- Freeport-McMoRan's copper production 2010-2023
- Molycorp's revenue 2008-2014
- Rio Tinto's net income 2001-2023
- Comparison of cobalt consumption in the U.S. 2010-2023
- Iron ore prices 2000-2022
- Thermal coal prices 2013-2022
- Rare earths demand growth rates for specific industry sectors 2010-2015
- Rio Tinto's uranium production 2010-2023
Thomson Reuters, & GFMS. (May 31, 2019). Global palladium demand for dental applications by region from 2013 to 2018 (in 1,000 ounces) [Graph]. In Statista. Retrieved March 19, 2024, from https://www.statista.com/statistics/418257/global-palladium-demand-for-dental-applications-by-region/
Thomson Reuters, und GFMS. "Global palladium demand for dental applications by region from 2013 to 2018 (in 1,000 ounces)." Chart. May 31, 2019. Statista. Accessed March 19, 2024. https://www.statista.com/statistics/418257/global-palladium-demand-for-dental-applications-by-region/
Thomson Reuters, GFMS. (2019). Global palladium demand for dental applications by region from 2013 to 2018 (in 1,000 ounces). Statista. Statista Inc.. Accessed: March 19, 2024. https://www.statista.com/statistics/418257/global-palladium-demand-for-dental-applications-by-region/
Thomson Reuters, and GFMS. "Global Palladium Demand for Dental Applications by Region from 2013 to 2018 (in 1,000 Ounces)." Statista, Statista Inc., 31 May 2019, https://www.statista.com/statistics/418257/global-palladium-demand-for-dental-applications-by-region/
Thomson Reuters & GFMS, Global palladium demand for dental applications by region from 2013 to 2018 (in 1,000 ounces) Statista, https://www.statista.com/statistics/418257/global-palladium-demand-for-dental-applications-by-region/ (last visited March 19, 2024)
Global palladium demand for dental applications by region from 2013 to 2018 (in 1,000 ounces) [Graph], Thomson Reuters, & GFMS, May 31, 2019. [Online]. Available: https://www.statista.com/statistics/418257/global-palladium-demand-for-dental-applications-by-region/