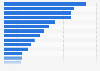
This statistic shows the worst jobs in the U.S. in 2015. The worst job was newspaper reporter with a job score of 737.
Worst jobs in the United States in 2015
Basic Account
Get to know the platform
You only have access to basic statistics.
This statistic is not included in your account.
Starter Account
The ideal entry-level account for individual users
- Instant access to 1m statistics
- Download in XLS, PDF & PNG format
- Detailed references
$189 USD $149 USD / Month *
in the first 12 months
Professional Account
Full access
Business Solutions including all features.
* Prices do not include sales tax.
Other statistics that may interest you Statistics on
About the industry
10
- Premium Statistic Share of high-earning independent workers in U.S. 2011-2022
- Basic Statistic Number of employees of the forestry and logging industry in Canada 2008-2022
- Premium Statistic Share of full-time independent workers who prefer a traditional job U.S. 2012-2020
- Premium Statistic Reasons for choosing independent work in the U.S. by gender 2020
- Premium Statistic Burnout rates in the Netherlands 2010-2018
- Premium Statistic Reasons not to change jobs in the Netherlands 2019
- Premium Statistic Employees with flexible work hours by type New Zealand 2018
- Premium Statistic Employee work stress New Zealand 2018 by frequency
- Premium Statistic Employer job stress New Zealand 2018 by frequency
- Premium Statistic Self-employed job stress New Zealand 2018 by frequency
About the region
10
- Premium Statistic Average lunch break duration in North America in 2017, by country
- Basic Statistic Employee expectations that HR check in with them during their first year U.S. 2018
- Premium Statistic Share of employees who would refer a friend based on the onboarding program U.S. 2018
- Premium Statistic Length of time employees in the U.S. will spend filling out a job application 2018
- Premium Statistic Leading frustrations when looking for a job in the U.S. 2018
- Premium Statistic Leading ways employees want job applications to be acknowledged U.S. 2018
- Basic Statistic How long prospective employees in the U.S. are willing to wait for a response 2018
- Premium Statistic How long prospective employees are willing to wait for a response U.S. by age 2018
- Premium Statistic Prospective employee expectations for a clear timeline and updates U.S. by age 2018
- Premium Statistic Expectations for personal notifications of job opportunities by generation U.S. 2018
Selected statistics
4
- Premium Statistic Workforce of not-for-profit theaters in the U.S. 2009-2021
- Premium Statistic Reasons for U.S. employers to implement employee/family assistance initiatives 2014
- Basic Statistic Work/study situation of recent graduates in the U.S. 2012
- Basic Statistic U.S. university graduates median starting salaries 2012, various categories
Other regions
10
- Premium Statistic China's Consolidated Jobs Index August 2022
- Premium Statistic Most important side job considerations for Millennials in the Netherlands 2019
- Premium Statistic Share of French employees satisfied or not with their work-life balance 2019
- Premium Statistic Response to gender pay gap among working women in India by education level 2018
- Premium Statistic Global onboarding program maturity by region 2018
- Basic Statistic Public opinion: Most important issues facing the United Kingdom (UK) 2017
- Premium Statistic Distribution of Canadian employee satisfaction in 2016, by occupation
- Premium Statistic Employees with paid leave entitlement by type New Zealand 2018
- Basic Statistic Youth unemployment rate in Angola in 2022
- Basic Statistic Youth unemployment rate in Morocco in 2022
Related statistics
10
- Premium Statistic Best jobs in the U.S. 2015
- Basic Statistic Workforce preparedness of university graduates in the U.S. in 2012
- Basic Statistic Youth employment field satisfaction rates, by race in the U.S. 2011
- Basic Statistic U.S. unemployment rates for large metropolitan areas 2023
- Basic Statistic U.S. monthly change in real hourly earnings 2022-2023
- Basic Statistic U.S. monthly average hourly earnings for all employees 2011-2023
- Basic Statistic U.S. youth unemployment rate seasonally adjusted 2021-2023
- Basic Statistic U.S. unadjusted unemployment rate 2021-2023
- Basic Statistic U.S. seasonally adjusted unemployment rate 2021-2023
- Basic Statistic U.S. civilian labor force seasonally adjusted 2021-2023
Further related statistics
10
- Number of Rio Tinto's employees 2010-2022
- Number of CBRE Group employees 2009-2022
- Main employment centers of HSBC in 2022, by number of employees
- Johnson & Johnson's number of employees 2004-2022
- Net fees income of Hays worldwide 2007-2022
- Biofuels related jobs worldwide by region 2019
- Number of food-preparation workers in the restaurant industry in the U.S. 2010-2026
- Number of bartenders employed in the restaurant industry in the U.S. 2010-2026
- Number of waiters and waitresses in the restaurant industry in the U.S. 2010-2026
- Reasons restaurant employees took a break from the industry in the U.S. as of 2013
Further Content: You might find this interesting as well
Statistics
- Number of Rio Tinto's employees 2010-2022
- Number of CBRE Group employees 2009-2022
- Main employment centers of HSBC in 2022, by number of employees
- Johnson & Johnson's number of employees 2004-2022
- Net fees income of Hays worldwide 2007-2022
- Biofuels related jobs worldwide by region 2019
- Number of food-preparation workers in the restaurant industry in the U.S. 2010-2026
- Number of bartenders employed in the restaurant industry in the U.S. 2010-2026
- Number of waiters and waitresses in the restaurant industry in the U.S. 2010-2026
- Reasons restaurant employees took a break from the industry in the U.S. as of 2013
Website (Careercast.com). (April 30, 2015). Worst jobs in the United States in 2015 [Graph]. In Statista. Retrieved September 21, 2023, from https://www.statista.com/statistics/507240/worst-jobs-us-2015/
Website (Careercast.com). "Worst jobs in the United States in 2015." Chart. April 30, 2015. Statista. Accessed September 21, 2023. https://www.statista.com/statistics/507240/worst-jobs-us-2015/
Website (Careercast.com). (2015). Worst jobs in the United States in 2015. Statista. Statista Inc.. Accessed: September 21, 2023. https://www.statista.com/statistics/507240/worst-jobs-us-2015/
Website (Careercast.com). "Worst Jobs in The United States in 2015." Statista, Statista Inc., 30 Apr 2015, https://www.statista.com/statistics/507240/worst-jobs-us-2015/
Website (Careercast.com), Worst jobs in the United States in 2015 Statista, https://www.statista.com/statistics/507240/worst-jobs-us-2015/ (last visited September 21, 2023)
Worst jobs in the United States in 2015 [Graph], Website (Careercast.com), April 30, 2015. [Online]. Available: https://www.statista.com/statistics/507240/worst-jobs-us-2015/