Skip to main content
Consumer Goods & FMCG
E-Commerce
Economy & Politics
Energy & Environment
Health, Pharma & Medtech
Internet
Media
Technology & Telecommunications
Transportation & Logistics
Travel, Tourism & Hospitality
View all industries
Global data volume growth
Global AI market size
Number of generative AI users worldwide
Global inflation rate
Retail e-commerce sales worldwide
Largest economies worldwide
Biggest social media platforms by users
Global EV market share by manufacturer
International tourist arrivals by world region
Global annual CO₂ emissions
Browse recent statistics
Artificial intelligence (AI) worldwide
TikTok
Nvidia
E-commerce worldwide
Global GDP
Instagram
Apparel market worldwide
Video gaming worldwide
Global renewable energy industry
Influencer marketing worldwide
Browse recent topics
Consumer Trends 2026
Artificial Intelligence: in-depth market analysis
E-commerce challenges
Global economy
TikTok
Luxury goods: in-depth market analysis
Electric vehicles: A global overview
Video gaming worldwide
Travel and tourism trends 2026
Battery recycling worldwide
Browse recent reports
Explore the tool
Explore Classic mode
Advertising & Media
eCommerce
Consumer
Finance
Global Indicators
Health
Industrial
Mobility
Technology
Explore Market Insights
eCommerce Insights
Research AI
Book a demo
All integrations
Developer docs
Explore Statista Connect
Research
Strategy & Consulting
Marketing
Media & PR
Explore AI assistants
Marketing
Research & Development
Strategy
Sales
Find the fact
Tell the story
Win the pitch
Understand the market
Develop your strategy
Academia
Agencies
Consultancies
Consumer goods
Finance
Tech
Research solutions
Strategy consulting
Communication services
Explore Statista+
Statista R
Statista Healthcare
About Statista
First steps & help center
Webinar & training hub
Success stories
Individuals & Small Teams
Businesses & Enterprises
Academia & Government
English
Deutsch
Daily Data
Global stories vividly visualized
Stock market
Mar 12, 2021
This chart shows the number of SPAC IPOs in the U.S. between 2009-2021.
More Information
Coronavirus
Mar 12, 2021
This chart shows the states with the highest/lowest percentage of their population with at least one COVID-19 vaccine dose.
More Information
5G
Mar 12, 2021
This chart shows the projected contribution for 5G to U.S. GDP from 2021-2025, by industry (in billion U.S. dollars).
More Information
Coronavirus
Mar 12, 2021
This chart shows the number of daily COVID-19 cases in U.S. children from Oct. 2020 to March 4, 2021.
More Information
World Kidney Day
Mar 11, 2021
This chart shows the number of organ transplants by type in the U.S. between 1988 and 2020.
More Information
Toll Roads
Mar 11, 2021
This chart shows the average cost of toll rolls by country in 2021.
More Information
Covid-19 Outbreak
Mar 11, 2021
This chart shows the composition of the American Rescue Plan Act (in billion U.S. dollars).
More Information
Conflict
Mar 11, 2021
This chart shows minimum reported civilian deaths per year by conflict.
More Information
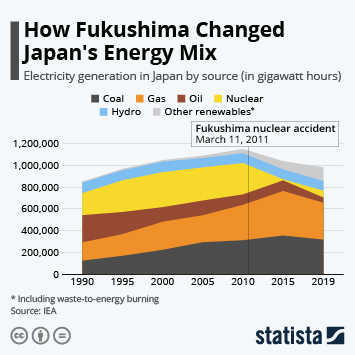
10 Years After Fukushima
Mar 11, 2021
This chart shows electricity generated in Japan by source from 1990 to 2019.
More Information
COVID-19
Mar 10, 2021
This chart shows the number of daily new COVID-19 infections in the EU, the U.S., India and Brazil in 2020 and 2021 (two-week rolling...
More Information
Infrastructure
Mar 10, 2021
This chart shows cumulative infrastructure investment needs in the U.S. from 2020 to 2029.
More Information
United Kingdom
Mar 10, 2021
This charts shows episodes of TV shows prompting the most complaints from UK viewers since 2011.
More Information
Soccer
Mar 9, 2021
This chart shows Indian Super League soccer teams with the highest combined player market values as of March 1, 2021 (in million U.S....
More Information
Impact of COVID-19 on the job market
Mar 9, 2021
This chart shows the percentage of respondents who would move to each country for work.
More Information
Economic Impact of COVID-19
Mar 9, 2021
This chart shows global GDP projections made in November 2019 and March 2021, indexed to the level of Q4 2019.
More Information
Covid-19 Outbreak
Mar 9, 2021
This chart shows the status of travel restrictions for international tourism as of February 01, 2021.
More Information
Cruise Lines
Mar 9, 2021
This chart shows revenue of the largest cruise lines in 2019 and 2020.
More Information
Super Rich Populations
Mar 8, 2021
This chart shows the forecast five-year growth in UHNWI populations (2020-2025).
More Information
Hurun Rich List
Mar 8, 2021
This chart shows the number of billionaires in selected countries in 2021, by national origin/descent.
More Information
Russia
Mar 8, 2021
This chart shows support For Putin among the Russian public.
More Information
Container Shipping
Mar 8, 2021
This chart shows the Shanghai and Ningbo Containerized Freight Indices in 2020/21.
More Information
Football
Mar 5, 2021
This chart looks at football clubs which were in first place in their respective leagues at the end of 2020 and have since fallen a...
More Information
Covid-19 outbreak
Mar 5, 2021
This chart shows the share of respondents who would support easing Covid-19 restrictions.
More Information
Retail
Mar 5, 2021
This chart shows annual change in UK retail spending in leisure sector markets in 2020.
More Information
Music industry
Mar 5, 2021
This chart shows how important streaming has become for the music industry.
More Information
Foreign policy
Mar 4, 2021
This chart shows the percentage of U.S. adults who say America should remain a member of each group.
More Information
Disney Stores
Mar 4, 2021
This chart shows the number of retail stores owned and operated by the Walt Disney Company.
More Information
Golf
Mar 3, 2021
This chart shows the all-time highest-earning nations on the LPGA Tour (in million U.S. dollars)
More Information
Budget 2021
Mar 3, 2021
This chart shows tax as a share of nominal GDP in the UK since 1948.
More Information
World Day of Prayer
Mar 3, 2021
This chart shows the share of respondents in selected countries who said they prayed daily.
More Information
LGBT Americans
Mar 3, 2021
This chart shows self-identified sexual orientation of LGBT adults in the U.S. in 2020.
More Information
Rent prices
Mar 2, 2021
This chart shows the median monthly rent prices in Manhattan and Brooklyn in 2020 (in thousand U.S. dollars).
More Information
Emissions
Mar 2, 2021
This chart shows the percent year-over-year change in global carbon dioxide emissions in 2020.
More Information
Covid-19
Mar 2, 2021
This chart shows the change in movements in the UK after the coronavirus lockdown as recorded by Google location data, by category.
More Information
Secondary Sneaker Market
Mar 2, 2021
This chart shows gross merchandise volume and the most popular sneaker brands on resale platform StockX.
More Information
South Korea
Mar 2, 2021
This chart shows the monthly change in exports (year-on-year) from South Korea.
More Information
Food Security
Mar 2, 2021
This chart shows index scores for the affordability, availability, natural resources, safety and quality of food in 2020.
More Information
Minimum wage
Mar 1, 2021
This chart shows the projected U.S. minimum wage if it rose alongside productivity, 1950-2020.
More Information
Carbon emissions
Mar 1, 2021
This chart shows the countries with the highest per-capita carbon emissions, in metric tons of carbon dioxide.
More Information
Afghanistan
Mar 1, 2021
This chart shows the use and condition of capital assets funded by the U.S. in Afghanstan as of 2021.
More Information
COVID-19
Mar 1, 2021
This chart shows COVID-19 deaths per 100,000 of the population in the 10 worst affected countries.
More Information
Homelessness
Feb 26, 2021
This chart looks at figures related to rough sleeping in England in January 2021 and the effects of a government initiative to reduce...
More Information
Urbanization
Feb 26, 2021
This chart shows the cities with the fastest average annual growth rates in the world between 2020-2025.
More Information
Clean energy
Feb 25, 2021
This chart shows the amount of money committed through policies by G20 countries since the pandemic began in 2020 for each energy type...
More Information
5G
Feb 25, 2021
This chart shows the companies with most 5G patent families and patent families applications (2021).
More Information
Golden Globes
Feb 25, 2021
This chart shows the number of 'Best Picture' winners at the Oscars since 1950 that did/did not win a Golden Globe before.
More Information
Short-Term Rentals
Feb 25, 2021
This chart shows the year-over-year change in booked Airbnb and Vrbo listings worldwide.
More Information
E-Waste
Feb 25, 2021
This chart shows the countries producing the most e-waste per capita in 2019.
More Information
U.S. Federal Prison System
Feb 25, 2021
This chart shows the number of federal inmates in custody excluding private prisons.
More Information
Covid-19 Pandemic
Feb 25, 2021
This chart shows confirmed orders for the Janssen Ad26.COV2.S vaccine.
More Information
Pokémon
Feb 25, 2021
This chart shows global unit sales of the best-selling Pokémon video games.
More Information
Health
Feb 25, 2021
This chart presents the results and projected effects of England's 2003 salt reduction programme.
More Information
Foreign relations
Feb 24, 2021
This chart shows the percentage of U.S. adults who are confident President Biden will deal with China effectively.
More Information
Media Franchises
Feb 24, 2021
This chart shows the estimated all-time revenue of the most valuable media franchises in the world (in billion U.S. dollars).
More Information
Ageing Society
Feb 24, 2021
This chart shows the population of South Korea by age group (2011-2020).
More Information
Travel
Feb 24, 2021
This chart compares selected KPIs of Heathrow Airport in 2019 and 2020.
More Information
COVID-19 Vaccination
Feb 24, 2021
This chart shows public support for mandatory COVID-19 vaccination in selected countries.
More Information
Qatar
Feb 24, 2021
This chart shows deaths of South Asian migrants in Qatar from 2011 to late 2020.
More Information
Automation
Feb 24, 2021
This chart shows changes to workplaces in China and the world through automation between 2018 and 2030.
More Information
Grand Slam titles of active female tennis players
Feb 24, 2021
This chart ranks active female tennis players by the number of Grand Slam titles they won.
More Information
War & Conflict
Feb 24, 2021
This chart shows civilian deaths and injuries in the Afghanistan conflict.
More Information
Coronavirus
Feb 23, 2021
This chart shows the percentage of U.S. adults who will get a coronavirus vaccine once it becomes available.
More Information
Internet Quality
Feb 23, 2021
This chart shows the countries with the highest and lowest scores on the Internet Quality Index (2020).
More Information
Covid-19
Feb 23, 2021
This chart shows the unemployment rate in the UK.
More Information
Spotify
Feb 23, 2021
The chart shows the countries where Spotify is available before and after its expansion announced on Feb. 22, 2021.
More Information
Covid-19 Pandemic
Feb 23, 2021
This chart shows U.S. Covid-19 deaths compared to the number of Americans who died in selected wars.
More Information
Housing
Feb 22, 2021
This chart shows the number of new privately-owned housing units started in the U.S. between Jan. 2020 and Jan. 2021 (in thousands).
More Information
COVID-19 Deaths
Feb 22, 2021
This chart shows cumulative COVID-19 deaths for the worst affected countries as of February 21, 2021.
More Information
Covid-19 Pandemic
Feb 22, 2021
This chart shows countries that have not started Covid-19 vaccinations.
More Information
New Survey
Feb 22, 2021
This chart shows supermarket chains in the UK ranked by customer satisfaction in 2020.
More Information
"Love Your Pet" Day
Feb 19, 2021
This chart shows the states with the most shelter pets in the U.S.in 2019 as well as overall number of pets surrendered and euthanized...
More Information
Space Exploration
Feb 19, 2021
This chart shows estimated life-cycle costs of Mars missions (inflation-adjusted).
More Information
Illegal immigration
Feb 19, 2021
This chart shows estimates for undocumented immigrant populations in the U.S. in 2017.
More Information
Retail
Feb 19, 2021
This chart shows estimated year-over-year change in retail sales in the U.S. in January 2021.
More Information
Operating systems
Feb 19, 2021
This chart shows the percent global market share for desktop operating systems in 2020.
More Information
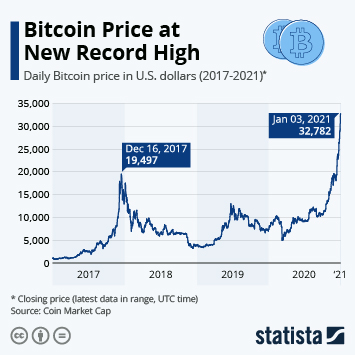
Cryptocurrency
Feb 18, 2021
This chart shows changes in the daily value of Bitcoin (2017-2021).
More Information
Health
Feb 18, 2021
This chart shows the Covid-19 cases reported per 1,000 tests conducted in the United Kingdom.
More Information
Reddit
Feb 18, 2021
This chart shows government requests to remove content on Reddit by country in 2020.
More Information
Education
Feb 17, 2021
This chart shows the percentage of U.S. voters who say schools should wait to reopen until all teachers are vaccinated.
More Information
Apparel Brands
Feb 17, 2021
This chart shows the world's most valuable apparel brands as of 2020 and the market capitalization of them or their parent companies...
More Information
Brexit
Feb 17, 2021
UK's status in European economic, trade and travel agreements.
More Information
U.S. Power Outages
Feb 17, 2021
This chart shows the share of energy (MWh) generated by fuel type in Texas in 2020.
More Information
U.S. Power Outages
Feb 17, 2021
This chart shows the number of customers disconnected during peak U.S. power outages on Feb 16, 2021.
More Information
Fossil fuels
Feb 16, 2021
This chart shows the total annual change in power generation in India, by fuel type (in terawatt-hours).
More Information
Stock market
Feb 16, 2021
This chart shows the percentage of investors who describe the current stock market in each way.
More Information
Myanmar Coup
Feb 16, 2021
This chart shows Myanmar on selected indices in 2020 and 2010 (before military rule ended).
More Information
GDP
Feb 16, 2021
This chart shows the annualized quarter on-quarter real GDP growth in Japan between 2008 and 2020.
More Information
Fasting for Lent
Feb 16, 2021
This chart shows the most popular things to give up for Lent, by share of Lent tweets mentioning them (in percent).
More Information
Electric Mobility
Feb 16, 2021
This chart ranks the six largest markets in terms of electric passenger car sales in 2020.
More Information
Covid-19 Pandemic
Feb 16, 2021
This chart shows the number of countries using selected Covid-19 vaccines as of February 16, 2021.
More Information
67
/
161
Contact
Get in touch with us. We are happy to help.
Do you still have questions?
Feel free to contact us anytime using our
contact form
or visit our
FAQ page
.
Your contact to the Infographics Newsroom
Felix Richter
Data Journalist
felix.richter@statista.com
+49 (40) 284 841 557