Skip to main content
Consumer Goods & FMCG
E-Commerce
Economy & Politics
Energy & Environment
Health, Pharma & Medtech
Internet
Media
Technology & Telecommunications
Transportation & Logistics
Travel, Tourism & Hospitality
View all industries
Global data volume growth
Global AI market size
Number of generative AI users worldwide
Global inflation rate
Retail e-commerce sales worldwide
Largest economies worldwide
Biggest social media platforms by users
Global EV market share by manufacturer
International tourist arrivals by world region
Global annual CO₂ emissions
Browse recent statistics
Artificial intelligence (AI) worldwide
TikTok
Nvidia
E-commerce worldwide
Global GDP
Instagram
Apparel market worldwide
Video gaming worldwide
Global renewable energy industry
Influencer marketing worldwide
Browse recent topics
Consumer Trends 2026
Artificial Intelligence: in-depth market analysis
E-commerce challenges
Global economy
TikTok
Luxury goods: in-depth market analysis
Electric vehicles: A global overview
Video gaming worldwide
Travel and tourism trends 2026
Battery recycling worldwide
Browse recent reports
Explore the tool
Explore Classic mode
Advertising & Media
eCommerce
Consumer
Finance
Global Indicators
Health
Industrial
Mobility
Technology
Explore Market Insights
eCommerce Insights
Research AI
Book a demo
All integrations
Developer docs
Explore Statista Connect
Research
Strategy & Consulting
Marketing
Media & PR
Explore AI assistants
Marketing
Research & Development
Strategy
Sales
Find the fact
Tell the story
Win the pitch
Understand the market
Develop your strategy
Academia
Agencies
Consultancies
Consumer goods
Finance
Tech
Research solutions
Strategy consulting
Communication services
Explore Statista+
Statista R
Statista Healthcare
About Statista
First steps & help center
Webinar & training hub
Success stories
Individuals & Small Teams
Businesses & Enterprises
Academia & Government
English
Deutsch
Daily Data
Global stories vividly visualized
UK Politics
Apr 15, 2021
This chart shows the extent to which the British public is aware of/following the David Cameron/Greensill Capital story.
More Information
Pandemic
Apr 15, 2021
This chart compares the annual change to quarterly GDP in selected countries in 2020 compared to the OECD average.
More Information
Afghanistan
Apr 15, 2021
This chart shows the length of U.S. involvement in foreign military conflicts as of April 2021
More Information
Environment
Apr 14, 2021
This chart shows the countries/areas causing the largest share of tropical deforestation associated with international trade from 2005...
More Information
Tech companies
Apr 14, 2021
This chart shows the annual revenue of Toshiba from FY2008-2020 (in billion U.S. dollars).
More Information
Capital Cities
Apr 14, 2021
This chart shows the contribution of selected capital city regions to their countries' GDP (2018).
More Information
COVID-19 vaccines
Apr 14, 2021
This chart shows the total number of COVID-19 vaccine doses administered in the U.S. by manufacturer.
More Information
COVID-19 Vaccination
Apr 14, 2021
This chart shows the total number of COVID-19 vaccine doses distributed and administered in the United States.
More Information
Artificial Intelligence
Apr 14, 2021
This chart shows the share of enterprises using artificial intelligence in the EU in 2020.
More Information
Pandemic
Apr 13, 2021
This chart shows the 7-day average new Covid-19 cases per 100,000 inhabitants in selected European countries in April 2021.
More Information
Turban Day
Apr 13, 2021
This chart shows volunteered survey responses about the regional origin and religion of Sikh people in traditional Sikh headgear (shown...
More Information
Covid-19
Apr 13, 2021
This chart shows the estimated Covid-19 reproduction number in Israel.
More Information
Covid-19
Apr 13, 2021
This chart shows daily new Covid-19 cases and the 7-day rolling average in Israel.
More Information
E-Commerce
Apr 12, 2021
This chart shows the Chinese e-commerce marketplaces with the biggest worlwide gross merchandise volumes in 2019 (in billion U.S. dollars).
More Information
Lockdown
Apr 12, 2021
This chart shows the share of UK CFOs who expect the bulk of their workforce to return to working in the office, by period.
More Information
Travel
Apr 12, 2021
This chart shows the change in Heathrow Airport passenger volume in 2020 and 2021.
More Information
Exports by State
Apr 12, 2021
This chart shows the U.S. states with most exports (in billion U.S. dollars).
More Information
Space Travel
Apr 12, 2021
This chart shows people who have spent the highest the number of days in space as of 2021.
More Information
Space Flight
Apr 12, 2021
This chart shows the number of male and female astronauts/cosmonauts launched into space by year.
More Information
COVID-19 Vaccinations
Apr 9, 2021
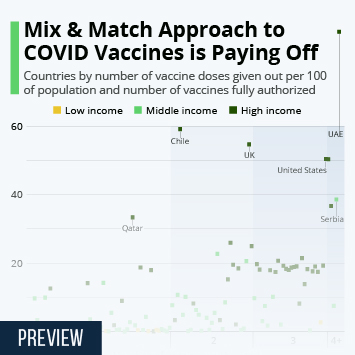
This chart shows countries by number of vaccine doses given out per 100 of population and number of vaccines fully authorized.
More Information
117th Congress
Apr 9, 2021
This chart shows the colleges/universities where most members of the 117th Congress received their first degree.
More Information
Politics
Apr 8, 2021
This chart shows voting intention in the 2021 London mayoral election.
More Information
TV Viewing
Apr 8, 2021
This chart shows gross minutes of selected nostagic comedy series viewed in the U.S.
More Information
Billionaires
Apr 8, 2021
This chart shows the number of billionaires living in cities in 2020.
More Information
Korea
Apr 7, 2021
This chart shows the projected share of the vote for each mayoral candidate in the 2021 South Korean by-election.
More Information
COVID-19 Vaccine rollout
Apr 7, 2021
This chart shows how many COVID-19 vaccine doses per 100 people have been administered in the EU, UK and United States.
More Information
Covid-19 Pandemic
Apr 7, 2021
This chart shows export requests for Covid-19 vaccine doses granted by the EU.
More Information
COVID-19
Apr 7, 2021
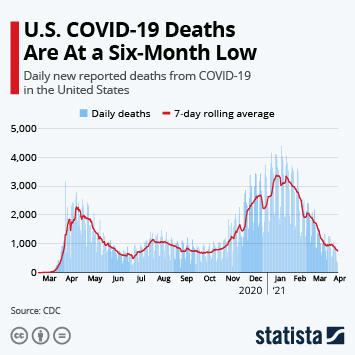
This chart shows daily new reported deaths from COVID-19 in the United States.
More Information
Ketchup
Apr 7, 2021
This chart shows the estimated number of people in the U.S. who used the following ketchup brands in 2020.
More Information
Craft Beer
Apr 7, 2021
This chart shows the number of operating craft breweries and millions of barrels produced in the U.S. from 2011 to 2020.
More Information
Covid-19
Apr 6, 2021
This chart shows the seven-day average number of Covid-19 vaccinations given in the UK in 2021.
More Information
U.S. Smartphone Market
Apr 6, 2021
This chart shows the most popular smartphone brands in the United States.
More Information
COVID-19 Vaccination
Apr 6, 2021
This chart shows survey responses about COVID-19 vaccinations in India (2020/21).
More Information
Murder
Apr 6, 2021
This chart shows how victims were killed in U.S. homicides in 2019.
More Information
Smartphone market
Apr 6, 2021
This chart ranks the world's largest smartphone brands based on their share of global shipments in 2020.
More Information
Infrastructure
Apr 6, 2021
This chart shows U.S. states by number of structurally deficient bridges in 2020.
More Information
COVID-19
Apr 1, 2021
This chart shows the 7-day rolling average of daily new COVID-19 cases per million of population in the most affected U.S. states.
More Information
Tourism
Apr 1, 2021
This chart shows the UK attractions with the largest annual decreases in visitor numbers in 2020.
More Information
Covid-19 Pandemic
Apr 1, 2021
This chart shows the number of deaths for all leading causes of death in the U.S. in 2020.
More Information
Coronavirus Vaccine
Mar 31, 2021
This chart shows COVID-19 vaccine exports from India, split into commercial deliveries and COVAX deliveries (in million doses).
More Information
Climate Change
Mar 31, 2021
This chart shows the peak of the cherry blossom bloom in Kyoto and 20-year rolling average (812-2021).
More Information
Frequent Flyers
Mar 31, 2021
Estimated share of the population who take the largest total share of flights.
More Information
Covid-19 Pandemic
Mar 30, 2021
Percentage change in visitor numbers to the world's 10 most visited art museums.
More Information
Starbucks
Mar 30, 2021
This chart shows the countries with at least one Starbucks store at the end of 2020.
More Information
Electricity
Mar 30, 2021
This chart shows electricity generation by source and country/region in 2000 and 2020 (in terrawatt hours).
More Information
Trade Unions
Mar 30, 2021
This chart shows union membership rates by U.S. state in 2020.
More Information
Education
Mar 29, 2021
This chart shows the number of children in the world below the minimum proficiency level in reading.
More Information
Maritime Trade
Mar 26, 2021
This chart shows the total volume of global maritime trade.
More Information
Biden Press Conference
Mar 25, 2021
This chart shows the average number of press conference held by sitting U.S. presidents and days until first solo conference.
More Information
Suez Canal
Mar 25, 2021
This chart shows the annual number of vessels and net tonnage transiting the Suez Canal.
More Information
COVID-19 in India
Mar 24, 2021
This charts shows the number of active coronavirus cases and new deaths in the most effective Indian states (as of March 23, 2021).
More Information
Semiconductors
Mar 24, 2021
This chart show the revenue of global automotive semiconductor production from 2012 to 2020 (projected).
More Information
Covid-19 Outbreak
Mar 24, 2021
This chart shows estimated Covid-19 vaccine doses produced compared to total vaccine production pre-Covid-19.
More Information
United States
Mar 24, 2021
This chart shows the most critical threats to the US over the next decade, as cited by U.S. adults.
More Information
Korean Exports
Mar 23, 2021
This chart shows the change in the export of selected products from South Korea in January and February 2021 (compared to Jan-Feb 2020).
More Information
Data privacy
Mar 23, 2021
This chart shows how much personal information selected apps share with third parties.
More Information
Covid-19 Outbreak
Mar 23, 2021
This chart shows the total number of Covid-19 vaccine doses produced by country.
More Information
Economic Impact of COVID-19
Mar 23, 2021
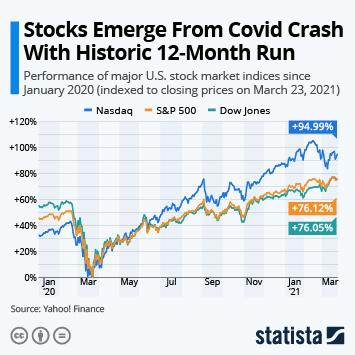
This chart shows the performance of major U.S. stock market indices since January 2020.
More Information
COVID-19 Second Wave
Mar 23, 2021
This chart shows coronavirus restrictions imposed in Europe during the second wave of the coronavirus pandemic (as of March 12, 2021).
More Information
Covid-19 Outbreak
Mar 23, 2021
This chart shows cumulative expected vaccine deliveries to the EU-27, Norway & Iceland in 2021.
More Information
Semiconductors
Mar 22, 2021
This chart shows the world's biggest producers of semiconductors.
More Information
PC Monitors
Mar 22, 2021
This chart shows worldwide PC monitor shipments.
More Information
Banking
Mar 22, 2021
This chart shows the results of a survey of 13 junior bankers about working conditions at Goldman Sachs.
More Information
Coronavirus
Mar 19, 2021
This chart presents a comparison of cumulative monthly UK government borrowing in 2019/20 and 2020/21.
More Information
Twitter turns 15
Mar 19, 2021
This chart compares 15-year-old Twitter with 15-year-old Facebook with respect to active user base, revenue, profit and market capitalization.
More Information
World Sleep Day
Mar 19, 2021
This chart shows minutes above and below eight hours of sleep in selected countries (in 2016).
More Information
Electric Vehicles
Mar 19, 2021
This chart shows share of the global vehicle fleet electrified in 2020 and 2030 (projected), by vehicle type.
More Information
Tech Companies
Mar 19, 2021
This chart shows the number of years selected tech companies have been in existence.
More Information
E-Mobility
Mar 18, 2021
This chart shows the regions/countries with the largest electric bus stocks.
More Information
Current Affairs
Mar 18, 2021
This chart shows the countries with the most ECHR judged violations of the European Convention on Human Rights in 2020.
More Information
House Prices
Mar 18, 2021
This chart shows the year-over-year change in house prices by country.
More Information
Hate Crime
Mar 17, 2021
This chart shows overall and anti-Asian hate crime reported to police in America's 15 largest cities in 2019 and 2020.
More Information
Cryptocurrency
Mar 17, 2021
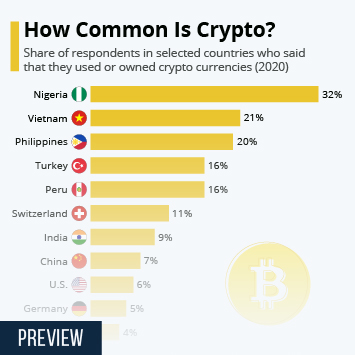
This chart shows the share of people owning or using of cryptocurrency in selected countries.
More Information
Academy Awards
Mar 17, 2021
This chart shows the number of Academy Award nominations earned by Netflix productions.
More Information
White Supremacy
Mar 17, 2021
This chart shows incidents involving the distribution of white supremacist propaganda in the U.S.
More Information
Air Pollution
Mar 16, 2021
This chart shows the levels of average PM2.5 air pollution in Asian countries/regional economies in 2020.
More Information
Air Pollution
Mar 16, 2021
This chart shows the average level of particulate matter (PM 2.5) pollution in 2020.
More Information
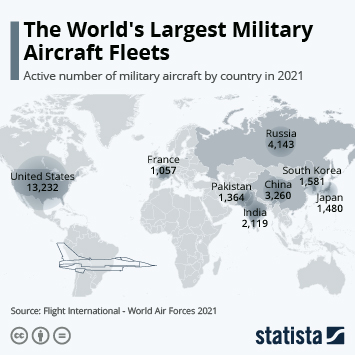
Military
Mar 16, 2021
This chart shows the active number of military aircraft by country in 2021.
More Information
Arms Industry
Mar 16, 2021
This chart shows the countries importing the highest value in arms from the UK from 2016 to 2020.
More Information
Arms Industry
Mar 16, 2021
This chart shows the countries that imported arms from the UK between 2016 and 2020.
More Information
European Union
Mar 16, 2021
This chart shows recipients of EU Member State citizenship/main countries that granted it in 2019.
More Information
Covid-19 Outbreak
Mar 16, 2021
Thi chart shows countries that have stopped using or halted rollouts of the AstraZeneca vaccine.
More Information
Syria War
Mar 16, 2021
This chart shows the human and economic cost of the war in Syria as of 2021.
More Information
Crime
Mar 15, 2021
This infographic presents figures related to female homicide victims in England & Wales in 2019-20.
More Information
United Kingdom
Mar 15, 2021
This chart shows the share of British women saying they have been sexually harassed in public in last 5 years.
More Information
Ag Subsidies
Mar 15, 2021
This chart shows support of agriculture as a share of GDP in selected countries in 2019.
More Information
Covid-19 Pandemic
Mar 15, 2021
This chart shows Covid-19 vaccine doses administered per day since January 01, 2021.
More Information
Violence Against Women
Mar 12, 2021
This chart shows the lifetime prevalence of intimate partner violence among women aged 15-49, by region.
More Information
Online marketplaces
Mar 12, 2021
This chart ranks the largest online marketplaces based on estimated gross merchandise volume in 2019.
More Information
Economy
Mar 12, 2021
This chart shows the change in UK trade from December 2020 to January 2021.
More Information
66
/
161
Contact
Get in touch with us. We are happy to help.
Do you still have questions?
Feel free to contact us anytime using our
contact form
or visit our
FAQ page
.
Your contact to the Infographics Newsroom
Felix Richter
Data Journalist
felix.richter@statista.com
+49 (40) 284 841 557