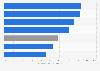
By the end of 2022, approximately 57.1 percent of the total population of Henan province in China were living in urban areas. Henan is one of the most populous provinces in China. It is located in China's middle region, next to Hebei, Shanxi, Shaanxi, Anhui and Hubei.
Urbanization rate in Henan, China from 1990 to 2022
Basic Account
Get to know the platform
You only have access to basic statistics.
This statistic is not included in your account.
Starter Account
The ideal entry-level account for individual users
- Instant access to 1m statistics
- Download in XLS, PDF & PNG format
- Detailed references
$199 USD / Month *
Professional Account
Full access
Business Solutions including all features.
* Prices do not include sales tax.
Other statistics that may interest you Statistics on
About the industry
10
- Premium Statistic Urban population in Henan, China 2012-2022
- Premium Statistic Gender ratio in Henan, China 1990-2022
- Premium Statistic Sex ratio of population in Shanxi China 2010-2022
- Premium Statistic Population of Jiangsu, China 1990-2022
- Premium Statistic Population with household registration in Shanxi China 2021, by city
- Premium Statistic Population with household registration in Sichuan China 2021, by city
- Premium Statistic Population with household registration in Hebei China 2021, by city
- Premium Statistic Population of major cities in China 2021
- Premium Statistic Rural population in Henan, China 2012-2022
- Premium Statistic Population in Henan, China 2022, by region
About the region
10
- Premium Statistic Labor force and employment in Nanchang, China 2019, by employment status
- Premium Statistic Labor force and employment in Lhasa, China 2019, by employment status
- Premium Statistic Labor force and employment in Tangshan 2019, by employment status
- Premium Statistic Labor force and employment in Jinan 2019, by employment status
- Premium Statistic Labor force and employment in Xi’an, China 2019, by employment status
- Premium Statistic Labor force and employment in Taiyuan 2019, by category
- Premium Statistic Labor force and employment in Zhengzhou, China 2019, by employment status
- Premium Statistic Labor force and employment in Lanzhou, China 2019, by employment status
- Premium Statistic Labor force and employment in Dalian 2019, by category
- Premium Statistic Labor force and employment in Wuhan, China 2019, by employment status
Selected statistics
2
Other regions
10
- Premium Statistic Labor force and employment in Changchun 2019, by employment status
- Basic Statistic Population of the Faroe Islands 2023, by municipality
- Premium Statistic Urbanization rate in Africa 2000-2025
- Basic Statistic Literacy rate in rural and urban Bihar India 2011 by gender
- Basic Statistic Population of Greenland 2023, by municipality and residence
- Basic Statistic Age structure in Croatia 2012-2022
- Basic Statistic Age structure in Estonia 2022
- Basic Statistic Age structure in Pakistan 2012-2022
- Basic Statistic Age structure in Peru 2022
- Basic Statistic Age structure in Thailand 2022
Related statistics
10
- Premium Statistic Labor force and employment in Shenyang 2019, by employment status
- Premium Statistic Labor force and employment in Guiyang, China 2019, by employment status
- Premium Statistic Labor force and employment in Harbin 2019, by employment status
- Premium Statistic Labor force and employment in Kunming, China 2019, by employment status
- Premium Statistic Labor force and employment in Shanghai 2019, by employment status
- Premium Statistic Labor force and employment in Urumqi, China 2019, by employment status
- Premium Statistic Labor force and employment in Nanjing 2019, by employment status
- Premium Statistic Labor force and employment in Hangzhou 2019, by employment status
- Premium Statistic Labor force and employment in Hefei 2019, by employment status
- Premium Statistic Labor force and employment in Changsha, China 2019, by employment status
Further related statistics
5
- Internet user distribution in China 2012-2023, by urban and rural region
- Cities with the most off-leash dog parks per 100,000 residents in the U.S. 2022
- Cities with the most recreation and senior centers per 20,000 residents U.S. 2022
- Total population of Myanmar in 2014, by gender
- Store number growth of the leading 100 retailers in China 2010-2012, by city tier
Further Content: You might find this interesting as well
Statistics
- Internet user distribution in China 2012-2023, by urban and rural region
- Cities with the most off-leash dog parks per 100,000 residents in the U.S. 2022
- Cities with the most recreation and senior centers per 20,000 residents U.S. 2022
- Total population of Myanmar in 2014, by gender
- Store number growth of the leading 100 retailers in China 2010-2012, by city tier
Henan Province Bureau of Statistics. (December 11, 2023). Urbanization rate in Henan, China from 1990 to 2022 [Graph]. In Statista. Retrieved April 25, 2024, from https://www.statista.com/statistics/1082467/china-urbanization-rate-in-henan/
Henan Province Bureau of Statistics. "Urbanization rate in Henan, China from 1990 to 2022." Chart. December 11, 2023. Statista. Accessed April 25, 2024. https://www.statista.com/statistics/1082467/china-urbanization-rate-in-henan/
Henan Province Bureau of Statistics. (2023). Urbanization rate in Henan, China from 1990 to 2022. Statista. Statista Inc.. Accessed: April 25, 2024. https://www.statista.com/statistics/1082467/china-urbanization-rate-in-henan/
Henan Province Bureau of Statistics. "Urbanization Rate in Henan, China from 1990 to 2022." Statista, Statista Inc., 11 Dec 2023, https://www.statista.com/statistics/1082467/china-urbanization-rate-in-henan/
Henan Province Bureau of Statistics, Urbanization rate in Henan, China from 1990 to 2022 Statista, https://www.statista.com/statistics/1082467/china-urbanization-rate-in-henan/ (last visited April 25, 2024)
Urbanization rate in Henan, China from 1990 to 2022 [Graph], Henan Province Bureau of Statistics, December 11, 2023. [Online]. Available: https://www.statista.com/statistics/1082467/china-urbanization-rate-in-henan/