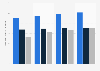
In 2022, Android users in the United States spent approximately five percent more time per month engaging with social video app TikTok than in 2021. By comparison, YouTube saw a decrease of around four percent year-over-year in engagement from Android users in the U.S. WhatsApp saw users in the country spending approximately three percent less time on the app, while Facebook registered a decrease in time spent of approximately four percent on its main platform's app.
Year-over-year growth in monthly hours spent on social media and communication apps on Android in the United States in 2022
Basic Account
Get to know the platform
You only have access to basic statistics.
This statistic is not included in your account.
Starter Account
The ideal entry-level account for individual users
- Instant access to 1m statistics
- Download in XLS, PDF & PNG format
- Detailed references
$149 USD / Month *
Professional Account
Full access
Business Solutions including all features.
* Prices do not include sales tax.
Other statistics that may interest you Mobile video in the United States
Overview
7
- Premium Statistic Most used smartphone apps by type in the U.S. 2023
- Premium Statistic Leading weekly smartphone activities by U.S. users 2022, by age
- Premium Statistic Leading smartphone activities for U.S. users 2022, by gender
- Premium Statistic Video streaming time worldwide 2022, by region and device
- Premium Statistic Most used devices for digital videos in the U.S. 2023
- Premium Statistic U.S. device usage for weekly online video viewing 2022, by age group
- Premium Statistic Screens for TV and video streaming in the U.S. and Canada 2022
Benchmarks
8
- Premium Statistic Reach of most popular U.S. smartphone apps 2023
- Premium Statistic Leading mobile apps in the United States 2023, by unique visitors
- Premium Statistic Awareness and download intent for selected social apps among U.S. consumers 2023
- Basic Statistic Most popular free services used to watch online videos in the U.S. 2022, by age group
- Basic Statistic Monthly time spent on selected mobile social apps in the U.S. 2022
- Premium Statistic U.S. yearly growth in monthly time spent using social media apps on Android 2022
- Basic Statistic Weekly hours spent on leading video streaming apps among U.S. Gen Z mobile users 2023
- Basic Statistic Most downloaded entertainment and streaming apps U.S. 2022
Reach and users engagement
8
- Premium Statistic Cumulative time spent with online video content in the U.S. 2019-2022, by device
- Premium Statistic Awareness and download intent for selected video apps among U.S. consumers 2023
- Premium Statistic Video and streaming apps with growing approval among U.S. consumer 2023
- Premium Statistic Mobile streaming apps attachment for U.S. consumers 2023
- Premium Statistic U.S. consumer ownership of streaming apps 2023
- Premium Statistic U.S. consumer who would recommend streaming apps to others 2023
- Premium Statistic Time spent watching no-cost streaming apps with ads in the U.S. 2023
- Premium Statistic U.S. children daily time on video apps 2022
AVoD and SVoD apps
6
- Premium Statistic Screens for TV and video streaming in the U.S. and Canada 2022
- Premium Statistic Video streaming apps in the U.S. 2022-2023
- Premium Statistic Devices used to watch Netflix TV series in the U.S. 2023
- Basic Statistic U.S. Netflix quarterly app downloads 2016-2023
- Basic Statistic U.S. HBO Max quarterly app downloads 2020-2023
- Basic Statistic U.S. Disney+ quarterly app downloads 2020-2023
Social video
8
- Basic Statistic U.S. user engagement on short video platform 2022
- Basic Statistic TikTok: number of users in the United States 2023-2027
- Premium Statistic TikTok U.S. monthly active users 2020-2023
- Premium Statistic Snapchat users in the United States 2018-2027
- Basic Statistic Snapchat: distribution of U.S. audiences 2023, by gender
- Basic Statistic YouTube Shorts most popular videos U.S. 2022
- Premium Statistic U.S. YouTube video engagement generated by selected content creators 2022
- Basic Statistic YouTube IAP revenues 2023, by region
Monetization
6
- Premium Statistic Top video streaming monetization models according to business owners worldwide 2022
- Premium Statistic Digital Market Outlook: digital video ad spending in the U.S. 2019-2028, by device
- Premium Statistic Digital Market Outlook: digital video ad spending change U.S. 2020-2028, by device
- Premium Statistic Digital Market Outlook: video ad spending per internet user U.S. 2019-2028, by device
- Premium Statistic Mobile ad spend in the U.S. 2010-2022
- Premium Statistic Programmatic digital video ad views in the U.S. 2022-2023, by device
Further Content: You might find this interesting as well
Data.ai. (January 3, 2023). Year-over-year growth in monthly hours spent on social media and communication apps on Android in the United States in 2022 [Graph]. In Statista. Retrieved December 11, 2023, from https://www.statista.com/statistics/1294874/growth-time-spent-top-social-media-apps-us/
Data.ai. "Year-over-year growth in monthly hours spent on social media and communication apps on Android in the United States in 2022." Chart. January 3, 2023. Statista. Accessed December 11, 2023. https://www.statista.com/statistics/1294874/growth-time-spent-top-social-media-apps-us/
Data.ai. (2023). Year-over-year growth in monthly hours spent on social media and communication apps on Android in the United States in 2022. Statista. Statista Inc.. Accessed: December 11, 2023. https://www.statista.com/statistics/1294874/growth-time-spent-top-social-media-apps-us/
Data.ai. "Year-over-year Growth in Monthly Hours Spent on Social Media and Communication Apps on Android in The United States in 2022." Statista, Statista Inc., 3 Jan 2023, https://www.statista.com/statistics/1294874/growth-time-spent-top-social-media-apps-us/
Data.ai, Year-over-year growth in monthly hours spent on social media and communication apps on Android in the United States in 2022 Statista, https://www.statista.com/statistics/1294874/growth-time-spent-top-social-media-apps-us/ (last visited December 11, 2023)
Year-over-year growth in monthly hours spent on social media and communication apps on Android in the United States in 2022 [Graph], Data.ai, January 3, 2023. [Online]. Available: https://www.statista.com/statistics/1294874/growth-time-spent-top-social-media-apps-us/