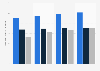
In 2022, TikTok was the app on which users in the United States spent the most time. On average, users spent over 26 hours per month on the app, a year-on-year increase of around 4.7 percent. Overall, U.S. internet users spent over 21 hours per month on the YouTube app, and 15 hours and 30 minutes on Facebook's app.
Leading social media apps in the United States in 2022, by average monthly user engagement (in hours, minutes)
Loading statistic...
Basic Account
Get to know the platform
You only have access to basic statistics.
Starter Account
The ideal entry-level account for individual users
- Instant access to 1m statistics
- Download in XLS, PDF & PNG format
- Detailed references
$69 USD $49 USD / Month *
in the first 12 months
Professional Account
Full access
Business Solutions including all features.
* Prices do not include sales tax.
Other statistics that may interest you
Mobile market overview
7
- Premium Statistic Mobile internet penetration rate worldwide 2022
- Premium Statistic Mobile internet usage reach in the United States 2019-2028
- Premium Statistic Mobile internet users in the United States 2019-2028
- Basic Statistic United States: digital population January 2023
- Premium Statistic Average daily media use in the U.S. 2022, by medium
- Premium Statistic Share of web page views in the U.S. 2021, by device
- Premium Statistic Share of U.S. mobile website traffic 2015-2023
Connectivity
4
Mobile usage and demographics
8
- Premium Statistic U.S. internet access Q3 2022, by device
- Premium Statistic Number of smartphone users in the United States 2013-2028
- Premium Statistic Smartphone ownership in the U.S. 2022, by age
- Premium Statistic Daily time spent on mobile phones in the U.S. 2019-2024
- Premium Statistic U.S. daily media usage time via mobile 2019-2023
- Premium Statistic Time spent using smartphone per week in U.S 2022, by age
- Premium Statistic Leading weekly smartphone activities by U.S. users 2022, by age
- Premium Statistic U.S. users smartphone activities at work 2021
Mobile apps
6
- Premium Statistic Reach of most popular U.S. smartphone apps 2023
- Premium Statistic Leading mobile apps in the United States 2023, by unique visitors
- Premium Statistic Most downloaded mobile apps U.S. 2022
- Premium Statistic U.S. daily median downloads needed for iPhone apps and games to rank first 2019-2022
- Basic Statistic U.S. daily median downloads needed for Android apps and games to rank first 2019-2022
- Premium Statistic Apps generating more than one million U.S. dollars from U.S. consumers 2016-2022
Mobile social
6
- Premium Statistic U.S. iOS users initial engagement with selected social apps 2023, by age
- Premium Statistic Social media apps daily open rate among U.S. active users Q2 2022
- Basic Statistic Most downloaded social media apps U.S. 2022
- Basic Statistic Monthly time spent on selected mobile social apps in the U.S. 2022
- Basic Statistic Devices used to access Facebook in the U.S. 2022
- Premium Statistic U.S. voters supporting a ban on Chinese-based social media 2022
Mobile gaming
7
- Premium Statistic Digital Market Outlook: digital gamers in the U.S. 2017-2027, by segment
- Premium Statistic Mobile games download growth in the U.S. 2021-2022, by genre
- Basic Statistic Reasons for playing mobile games in the U.S. 2022
- Premium Statistic Reasons to download apps for U.S. mobile gamers 2022
- Premium Statistic Number of apps used daily by mobile gamers in the U.S. 2022
- Premium Statistic U.S. mobile gaming subscriptions and virtual goods in-app spending 2020-2026
- Premium Statistic Mobile games revenue growth in the U.S. 2021-2022, by genre
Other apps
6
- Premium Statistic Fitness tracking apps market presence in the U.S. 2019-2022
- Premium Statistic Types of purchased health apps in the U.S. 2022
- Premium Statistic U.S. consumer spending on dates per month during inflation 2022, by dating app
- Premium Statistic Meditation and mindfulness apps market presence in the U.S. 2019-2022
- Basic Statistic Most popular photo and video editor apps in the U.S. 2022, by revenues
- Premium Statistic Language learning apps market presence in the U.S. 2019-2022
Mobile commerce and payments
8
- Basic Statistic U.S. average online shopping order value 2020-2022, by device
- Premium Statistic Main devices for online grocery shopping in the U.S. 2021
- Premium Statistic Leading shopping apps in the U.S. 2021, by monthly active users
- Premium Statistic Main mobile livestream shopping apps in the U.S. 2020-2022, by download share
- Premium Statistic Number of contactless mobile payment users in U.S. 2022, with a 2027 forecast
- Premium Statistic Most used mobile payments by brand in the U.S. 2022
- Basic Statistic U.S. support for law regulating app store payment processors 2022, by age
- Premium Statistic Apple Pay brand profile in the United States 2022
Further related statistics
14
- Monthly minutes spent on Facebook by U.S. users in 2013-215, by channel
- WhatsApp: monthly mobile minutes by U.S. users 2012-2013
- Snapchat: monthly mobile minutes by U.S. users 2013
- Twitter: monthly mobile minutes by U.S. users 2012-2013
- Millennials: social media access locations 2012
- Active mobile social media users in APAC countries 2017-2019
- U.S. mom social media device usage July 2014
- Mobile and non-mobile users of social networks in China 2011
- U.S. teens: digital activities 2012-2013
- Mobile social network user penetration in the United Kingdom (UK) 2012-2018
- France: mobile social network penetration 2010-2014
- Time spent on social media by U.S. internet users 2011-2012
- Most important mobile apps among 36 to 45-year-olds in Germany 2020
- Most important mobile apps among those aged 56 and above in Germany 2020
Further Content: You might find this interesting as well
Statistics
- Monthly minutes spent on Facebook by U.S. users in 2013-215, by channel
- WhatsApp: monthly mobile minutes by U.S. users 2012-2013
- Snapchat: monthly mobile minutes by U.S. users 2013
- Twitter: monthly mobile minutes by U.S. users 2012-2013
- Millennials: social media access locations 2012
- Active mobile social media users in APAC countries 2017-2019
- U.S. mom social media device usage July 2014
- Mobile and non-mobile users of social networks in China 2011
- U.S. teens: digital activities 2012-2013
- Mobile social network user penetration in the United Kingdom (UK) 2012-2018
- France: mobile social network penetration 2010-2014
- Time spent on social media by U.S. internet users 2011-2012
- Most important mobile apps among 36 to 45-year-olds in Germany 2020
- Most important mobile apps among those aged 56 and above in Germany 2020
We Are Social, & DataReportal, & Meltwater. (February 9, 2023). Leading social media apps in the United States in 2022, by average monthly user engagement (in hours, minutes) [Graph]. In Statista. Retrieved May 30, 2023, from https://www.statista.com/statistics/256347/time-spent-on-selected-mobile-social-networks-in-the-united-states/
We Are Social, und DataReportal, und Meltwater. "Leading social media apps in the United States in 2022, by average monthly user engagement (in hours, minutes)." Chart. February 9, 2023. Statista. Accessed May 30, 2023. https://www.statista.com/statistics/256347/time-spent-on-selected-mobile-social-networks-in-the-united-states/
We Are Social, DataReportal, Meltwater. (2023). Leading social media apps in the United States in 2022, by average monthly user engagement (in hours, minutes). Statista. Statista Inc.. Accessed: May 30, 2023. https://www.statista.com/statistics/256347/time-spent-on-selected-mobile-social-networks-in-the-united-states/
We Are Social, and DataReportal, and Meltwater. "Leading Social Media Apps in The United States in 2022, by Average Monthly User Engagement (in Hours, Minutes)." Statista, Statista Inc., 9 Feb 2023, https://www.statista.com/statistics/256347/time-spent-on-selected-mobile-social-networks-in-the-united-states/
We Are Social & DataReportal & Meltwater, Leading social media apps in the United States in 2022, by average monthly user engagement (in hours, minutes) Statista, https://www.statista.com/statistics/256347/time-spent-on-selected-mobile-social-networks-in-the-united-states/ (last visited May 30, 2023)
Leading social media apps in the United States in 2022, by average monthly user engagement (in hours, minutes) [Graph], We Are Social, & DataReportal, & Meltwater, February 9, 2023. [Online]. Available: https://www.statista.com/statistics/256347/time-spent-on-selected-mobile-social-networks-in-the-united-states/