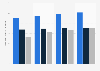
According to a 2021 study of iOS users in the United States, mobile users aged between 18 and 25 years old received an average of 154 notifications from Discord per week. Snapchat and Instagram followed in second and third place with 153 and 123 average weekly notifications respectively. Users in the U.S. tend to
Average weekly notifications received by Gen Z mobile users in the United States from selected social apps as of September 2021
Loading statistic...
Basic Account
Get to know the platform
You only have access to basic statistics.
Starter Account
The ideal entry-level account for individual users
- Instant access to 1m statistics
- Download in XLS, PDF & PNG format
- Detailed references
$59 USD $39 USD / Month *
in the first 12 months
Professional Account
Full access
Corporate solution including all features.
* Prices do not include sales tax.
Statistics on Snapchat
Overview
4
Financials
8
- Basic Statistic Snap worldwide annual revenue 2015-2021
- Basic Statistic Snap worldwide annual revenue 2016-2021, by region
- Basic Statistic Snap worldwide quarterly revenue 2015-2022
- Basic Statistic Snap advertising spending 2015-2021
- Basic Statistic Snap sales and marketing spending 2015-2021
- Basic Statistic Snap research and development spending 2015-2021
- Basic Statistic Snap worldwide EBITDA 2015-2021
- Basic Statistic Snap worldwide net income 2015-2021
Benchmark
8
- Basic Statistic Media usage in an online minute 2022
- Basic Statistic Global social networks ranked by number of users 2022
- Basic Statistic Global year-on-year social media audience growth 2022
- Basic Statistic Social media platforms growth of MAU worldwide 2019-2021
- Premium Statistic Net worth of the richest social media entrepreneurs 2022
- Premium Statistic Social media audiences in the U.S. 2021
- Premium Statistic U.S. social media brands used most often 2015-2021
- Basic Statistic U.S. adults who use selected social networks 2021
Users
8
- Premium Statistic Snapchat: number of global users 2018-2025
- Premium Statistic Number of Snapchat users in the United States 2020-2023
- Premium Statistic Snapchat user penetration in the United States 2017-2024
- Basic Statistic Daily active users of Snapchat 2014-2022
- Basic Statistic Daily active users of Snapchat 2014-2021, by region
- Basic Statistic Snap quarterly ARPU 2016-2022
- Basic Statistic Snap quarterly ARPU 2016-2022, by region
- Basic Statistic U.S. social media visits 2021, by frequency
Demographics
5
- Premium Statistic Gender distribution of social media audiences worldwide 2022, by platform
- Premium Statistic Snapchat: distribution of global audiences 2022, by age and gender
- Basic Statistic Snapchat: distribution of global audiences 2022, by gender
- Basic Statistic Instagram, Snapchat, and TikTok: Gen Z weekly usage in the U.S. 2019-2021
- Basic Statistic Snapchat: distribution of U.S. audiences 2022, by gender
User activities
8
- Basic Statistic Most downloaded mobile apps worldwide 2022
- Premium Statistic Global year-over-year download change in leading mobile apps 2021
- Premium Statistic Monthly time spent on leading social media apps worldwide 2021
- Premium Statistic Leading Android apps in the U.S. 2022, by downloads
- Premium Statistic Leading social apps for Gen Z users in the U.S. 2021, by weekly usage hours
- Premium Statistic Leading social apps for Gen Z in the U.S. 2021, by active user reach
- Basic Statistic Weekly notifications from social apps to U.S. Gen Z mobile users 2021
- Premium Statistic U.S. preferred social media platform to watch short-form videos 2021
Advertising and marketing
5
- Premium Statistic Social media platforms used by marketers worldwide 2022
- Premium Statistic Social media platforms used by marketers worldwide 2022, by target group
- Premium Statistic Most important social media platforms for marketers worldwide 2022
- Premium Statistic Changes in spending on digital platforms by marketers worldwide 2022
- Premium Statistic Leading social media used by small businesses for advertising in the U.S. 2021
Further related statistics
12
- U.S. mobile users that get annoyed by app push notifications 2017, by age group
- Volume of push notifications that prompt U.S. users to stop using an app 2017
- Moment companies ask to send push notifications in the Netherlands 2016
- Apps preferred for marketing push notifications in the United Kingdom (UK) 2014
- Reasons to encourage use of news alerts India 2019
- Share of consumers who use news alerts for mobile devices in Australia 2016-2018
- Frequency of being woken up during the night by notifications in France 2019
- Apps preferred for push notifications in the United Kingdom (UK) 2014
- Smartphone push notifications: user behavior in France 2013
- Canada: user interest in recieving deals or promos 2013
- Social media app permissions widely requested in China 2020, by type
- Badoo: current and past usage in the UK 2017, by usage of adult dating
Further Content: You might find this interesting as well
Statistics
- U.S. mobile users that get annoyed by app push notifications 2017, by age group
- Volume of push notifications that prompt U.S. users to stop using an app 2017
- Moment companies ask to send push notifications in the Netherlands 2016
- Apps preferred for marketing push notifications in the United Kingdom (UK) 2014
- Reasons to encourage use of news alerts India 2019
- Share of consumers who use news alerts for mobile devices in Australia 2016-2018
- Frequency of being woken up during the night by notifications in France 2019
- Apps preferred for push notifications in the United Kingdom (UK) 2014
- Smartphone push notifications: user behavior in France 2013
- Canada: user interest in recieving deals or promos 2013
- Social media app permissions widely requested in China 2020, by type
- Badoo: current and past usage in the UK 2017, by usage of adult dating
Measure Protocol. (February 18, 2022). Average weekly notifications received by Gen Z mobile users in the United States from selected social apps as of September 2021 [Graph]. In Statista. Retrieved February 07, 2023, from https://www.statista.com/statistics/1245420/us-notifications-to-social-app-ios-users/
Measure Protocol. "Average weekly notifications received by Gen Z mobile users in the United States from selected social apps as of September 2021." Chart. February 18, 2022. Statista. Accessed February 07, 2023. https://www.statista.com/statistics/1245420/us-notifications-to-social-app-ios-users/
Measure Protocol. (2022). Average weekly notifications received by Gen Z mobile users in the United States from selected social apps as of September 2021. Statista. Statista Inc.. Accessed: February 07, 2023. https://www.statista.com/statistics/1245420/us-notifications-to-social-app-ios-users/
Measure Protocol. "Average Weekly Notifications Received by Gen Z Mobile Users in The United States from Selected Social Apps as of September 2021." Statista, Statista Inc., 18 Feb 2022, https://www.statista.com/statistics/1245420/us-notifications-to-social-app-ios-users/
Measure Protocol, Average weekly notifications received by Gen Z mobile users in the United States from selected social apps as of September 2021 Statista, https://www.statista.com/statistics/1245420/us-notifications-to-social-app-ios-users/ (last visited February 07, 2023)
Average weekly notifications received by Gen Z mobile users in the United States from selected social apps as of September 2021 [Graph], Measure Protocol, February 18, 2022. [Online]. Available: https://www.statista.com/statistics/1245420/us-notifications-to-social-app-ios-users/