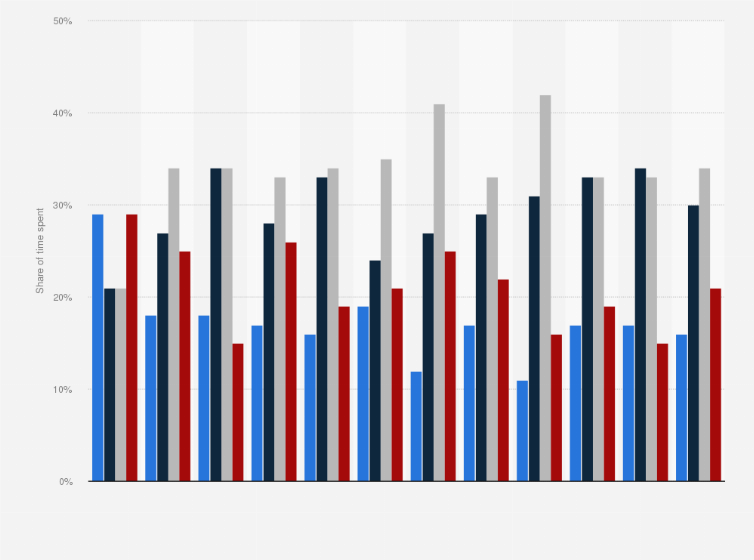
The 2024 Global Streaming Study found that streaming viewers across the most countries preferred TV shows or movies over live content. For example, in Sweden, series accounted for
**
Log in or register to access precise data.
percent and movies for
**
Log in or register to access precise data.
percent of the overall streaming viewing time. By contrast, Chinese consumers' desired content type was live programming, such as e-sports, video game streaming, and sporting events.
Adjust the presentation of the statistic and data points.
Share the statistic on social media channels or embed the statistic in your
website using "Embed Code", where available.
Cite this statistic and select one of the following formats: APA, Chicago, Harvard, MLA & Bluebook.
Print the statistic including description and metadata.
Chart type
Distribution of time spent watching content via streaming services in selected countries worldwide as of May 2024, by content type
Share this statistic
You have no right to use this feature.
Make sure to contact us if you are interested in scientific citation.
You can upgrade your account to enable this functionality for all statistics.
This feature is not available with your current account.Request access
Original question: “Thinking about the type of content you like to watch, how would you estimate your time spent watching content via streaming is split between the following types of content?”
Learn more about how Statista can support your business.
Simon-Kucher & Partners. (October 14, 2024). Distribution of time spent watching content via streaming services in selected countries worldwide as of May 2024, by content type [Graph]. In Statista. Retrieved September 20, 2025, from https://www.statista.com/statistics/1537580/time-spent-streaming-content-by-type-globally/
Simon-Kucher & Partners. "Distribution of time spent watching content via streaming services in selected countries worldwide as of May 2024, by content type." Chart. October 14, 2024. Statista. Accessed September 20, 2025. https://www.statista.com/statistics/1537580/time-spent-streaming-content-by-type-globally/
Simon-Kucher & Partners. (2024). Distribution of time spent watching content via streaming services in selected countries worldwide as of May 2024, by content type. Statista. Statista Inc.. Accessed: September 20, 2025. https://www.statista.com/statistics/1537580/time-spent-streaming-content-by-type-globally/
Simon-Kucher & Partners. "Distribution of Time Spent Watching Content via Streaming Services in Selected Countries Worldwide as of May 2024, by Content Type." Statista, Statista Inc., 14 Oct 2024, https://www.statista.com/statistics/1537580/time-spent-streaming-content-by-type-globally/
Simon-Kucher & Partners, Distribution of time spent watching content via streaming services in selected countries worldwide as of May 2024, by content type Statista, https://www.statista.com/statistics/1537580/time-spent-streaming-content-by-type-globally/ (last visited September 20, 2025)
Distribution of time spent watching content via streaming services in selected countries worldwide as of May 2024, by content type [Graph], Simon-Kucher & Partners, October 14, 2024. [Online]. Available: https://www.statista.com/statistics/1537580/time-spent-streaming-content-by-type-globally/
Advertisement
Profit from additional features with an Employee Account
Please create an employee account to be able to mark statistics as favorites.
Then you can access your favorite statistics via the star in the header.
Profit from the additional features of your individual account
Currently, you are using a shared account. To use individual functions (e.g., mark statistics as favourites, set
statistic alerts) please log in with your personal account.
If you are an admin, please authenticate by logging in again.