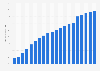
- Internet›
- Demographics & Use›
Daily online activities of adult U.S. internet users 2017, by gender
Industry-specific and extensively researched technical data (partially from exclusive partnerships).
A paid subscription is required for full access.
Most popular daily online activities of adult internet users in the United States as of February 2017, by gender
Exclusive Premium Statistic

Male | Female | |
---|---|---|
- | - | - |
- | - | - |
- | - | - |
- | - | - |
- | - | - |
- | - | - |
- | - | - |
- | - | - |
- | - | - |
- | - | - |
- | - | - |
- | - | - |
- | - | - |
- | - | - |
- | - | - |
Male | Female | |
---|---|---|
- | - | - |
- | - | - |
- | - | - |
- | - | - |
- | - | - |
- | - | - |
- | - | - |
- | - | - |
- | - | - |
- | - | - |
- | - | - |
- | - | - |
- | - | - |
- | - | - |
- | - | - |
You need a Premium Account for unlimited access.
Full access to 1.5m statistics
Incl. source references
Available to download in PNG, PDF, XLS format
You need a Premium Account for unlimited access.
Full access to 1.5m statistics
Incl. source references
Available to download in PNG, PDF, XLS format
© Statista 2019
About this statistic
Show source
Please be patient - this may take a moment
Description
Source
More information
- Show sources information
- Show publisher information
- Release date
- March 2017
- Region
- United States
- Survey time period
- February 2 to 8, 2017
- Number of respondents
- 1,455 respondents
- Age group
- 18 years and older
- Method of interview
- Online survey
- Region
- United States
- Survey time period
- February 2 to 8, 2017
- Number of respondents
- 1,455 respondents
- Age group
- 18 years and older
- Method of interview
- Online survey


You only have access to basic statistics.
This statistic is not included in your account!
- Instant access to 1m statistics
- Download in XLS, PDF & PNG format
- Detailed references
$49 / Month *
Corporate solution including all features.
Prices do not include sales tax.


All Information
in one Presentation
- 183 page/s
- English
- pptx
- Detailed references
Everything On "Internet usage in the United States" in One Document: Edited and Divided into Handy Chapters. Including Detailed References.
I think of Statista as Google for researchers. Statista provides you with the information you search for right away.Dr. Horst Stipp
EVP, Research & Innovation, Advertising Research Foundation
- Online access and traffic
- Countries with the highest number of internet users as of December 2017 (in millions)Countries with the highest number of internet users 2017
- Countries with the highest internet penetration rate as of January 2019Leading online markets based on penetration rate 2019
- Number of unique IPv4 addresses as of 1st quarter 2017, by country (in millions)Unique IPv4 addresses as of 1st quarter 2017, by country
- U.S. states with the highest average peak connection speed as of 1st quarter of 2017 (in Mbps)Highest peak connection speed in selected U.S. states 2017
- Number of fixed broadband subscriptions in the United States from 2000 to 2017 (in millions)Number of U.S. households with broadband internet access 2000-2017
- Mobile broadband subscriptions per 100 inhabitants in the United States from 2004 to 2017United States: mobile broadband subscriptions per 100 inhabitants 2004-2017
- Number of broadband internet subscribers in the United States from 2011 to 2018, by cable provider (in 1,000s)Broadband internet subscriber numbers in the U.S. 2011-2018, by cable provider
- Degree of internet freedom in selected countries according to the Freedom House Index 2018 (index points)Freedom House Index: internet freedom in selected countries 2018
- Online users
- Number of internet users in the United States from 2000 to 2016 (in millions)United States: number of internet users 2000-2016
- Number of internet users in the United States from 2017 to 2023 (in millions) United States: number of internet users 2017-2023
- Internet user penetration in the United States from 2017 to 2023United States internet usage penetration 2017-2023
- Percentage of population using the internet in the United States from 2000 to 2017United States internet penetration 2000-2017
- Number of unique visitors to leading mobile websites in the United States as of June 2017 (in millions)Most visited mobile websites in the United States 2017
- Number of unique visitors to leading desktop websites in the United States as of June 2017 (in millions)Most visited desktop websites in the United States 2017
- Share of adults in the United States who use the internet in 2018, by age groupU.S. internet usage penetration 2018, by age group
- Share of adults in the United States who use the internet in 2018, by genderU.S. internet usage penetration 2018, by gender
- Internet usage
- Adult internet usage penetration in the United States from 2000 to 2018, by age groupU.S. adult internet usage reach 2000-2018, by age group
- Adult internet usage penetration in the United States from 2000 to 2018, by genderU.S. adult internet usage reach 2000-2018, by gender
- Internet usage frequency of adults in the United States as of January 2018Frequency of internet usage by U.S. adults 2018
- Share of adults in the United States who are online almost constantly as of January 2018, by age groupU.S. adults who are online almost constantly 2018, by age
- Share of adults in the United States who are online almost constantly as of January 2018, by genderU.S. adults who are online almost constantly 2018, by gender
- Share of adults in the United States who are online almost constantly as of January 2018, by ethnicityU.S. adults who are online almost constantly 2018, by ethnicity
- Share of adults in the United States who are online almost constantly as of January 2018, by educational backgroundU.S. adults who are online almost constantly 2018, by education
- Share of adults in the United States who are online almost constantly as of January 2018, by incomeU.S. adults who are online almost constantly 2018, by income
- Mobile internet and apps
- Number of mobile phone internet users in the United States from 2017 to 2023 (in millions)United States: mobile phone internet users 2017-2023
- Mobile phone internet user penetration in the United States from 2017 to 2023United States: mobile phone internet user penetration 2017-2023
- Most popular activities on smartphones and tablets according to device owners in the United States as of May 2017Leading U.S. mobile activity reach on smartphone and tablets 2017
- Mobile audience reach of leading smartphone apps in the United States as of December 2018Reach of most popular U.S. smartphone apps 2018
- Leading iPhone apps in the Apple App Store in the United States in November 2018, by number of downloads (in millions)Leading iPhone apps in the U.S. 2018, by downloads
- Leading Android apps in the Google Play Store in the United States as of November 2018, by number of downloads (in millions)Leading Android apps in the U.S. 2018, by downloads
- Share of internet users in the United States who have used selected messenger apps to communicate with others as of August 2017Recent communication app usage in the U.S. 2017
- Most popular mobile messaging apps in the United States as of October 2018, by mobile reachLeading mobile messengers in the U.S. 2018, by reach
- Social media
- Share of internet users in the United States with accounts on selected social media platforms as of February 2018, by age groupU.S. social media account ownership 2018, by age group
- Mobile share of social media visits in the United States from 4th quarter 2017 to 4th quarter 2018Mobile share of U.S. social media visits 2017-2018
- Percentage of U.S. population who currently use any social media from 2008 to 2018Share of U.S. population who use social media 2008-2018
- Reach of selected social networks in the United States as of February 2017U.S. usage reach of leading social networks 2017
- Reach of selected social networks in the United States as of February 2017, by age groupU.S. usage reach of leading social networks 2017, by age group
- Leading social media websites in the United States in November 2016, based on share of visitsU.S. market share of leading social media websites 2016
- Most popular mobile music and video apps in the United States as of October 2018, by monthly users (in millions)Most popular entertainment apps in the U.S. 2018, by audience
- Most popular mobile social networking apps in the United States as of October 2018, by reachMost popular social media apps in the U.S. 2018, by reach
- Online and mobile commerce
- Retail e-commerce sales in the United States from 2017 to 2023 (in million U.S. dollars)United States: retail e-commerce sales 2017-2023
- Retail e-commerce sales including digital services in the United States from 2014 to 2022 (in billion U.S. dollars)United States: retail e-commerce sales 2014-2022
- Mobile retail e-commerce sales in the United States from 2013 to 2021 (in billion U.S. dollars)U.S. mobile retail commerce revenue 2013-2021
- Average value of online shopping orders in the United States from 2nd quarter 2012 to 4th quarter 2017 (in U.S. dollars)Average U.S. online shopping order value as of Q4 2017
- Number of digital buyers in the United States from 2013 to 2021 (in millions)United States: number of digital buyers 2013-2021
- Digital buyer penetration in the United States from 2013 to 2021United States: digital buyer penetration 2013-2021
- Number of mobile buyers in the United States from 2014 to 2020 (in millions)Number of mobile buyers in the United States 2014-2020
- Mobile buyer penetration in the United States from 2014 to 2019United States: mobile buyer penetration 2014-2019
- Adult U.S. internet users who get news online in 2012, by gender
- U.S. adult internet users who got news online yesterday 2011
- U.S. adult internet users who get news online in 2012, by ethnicity
- U.S. adult internet users who got news online yesterday 2011, by ethnicity
- Daily online activities of adult internet users in the United States 2012
- Most popular online activities of internet users in Central America 2013
- Most popular mobile activities of internet users in Central America 2013
- Weekly online activities of established internet users in the UK 2015
- Internet users who regularly visit advice websites in the United Kingdom 2012, by age
- Internet users regularly visiting gossip or celebrity news sites UK 2012, by age
- Share of American internet users who visited CraigsList in the U.S. 2018, by age
- Opinion on the best actors to fight hate speech on the Internet France 2018
- Most common online activities in Norway 2017
- Participation in online activities in Saudi Arabia 2017
- Italy: individuals using internet in 2017, by frequency of use
- Turkey: online use during purchase process 2015
- Usage rate of online public services Malaysia 2016 by purpose
- Level of concern about online activities being monitored in France 2015
- Percentage of children in selected countries reporting online activities 2016-2017
- Mexico: online activities of senior fixed internet users 2016, by education
- Internet usage in the United States
- Internet usage in Canada
- Internet usage in Japan
- Internet usage worldwide
- It-anvendelse i befolkningen 2018
- Internet usage in Finland
- Men and women online
- Internet usage in India
- Internet usage in Indonesia
- Internet usage in Latin America
- Internet usage in South Korea
- Internet usage in Mexico
- 14° Estudio sobre los Hábitos de los Usuarios de Internet en México 2018
- 13° Estudio sobre los Hábitos de los Usuarios de Internet en México 2017
- Internet usage in France
- Countries with the highest number of internet users as of December 2017 (in millions)
- Number of unique IPv4 addresses as of 1st quarter 2017, by country (in millions)
- U.S. states with the highest average peak connection speed as of 1st quarter of 2017 (in Mbps)
- Number of fixed broadband subscriptions in the United States from 2000 to 2017 (in millions)
- Mobile broadband subscriptions per 100 inhabitants in the United States from 2004 to 2017
- Degree of internet freedom in selected countries according to the Freedom House Index 2018 (index points)
- Percentage of mobile device website traffic in the United States from 1st quarter 2015 to 4th quarter 2018
- Websites in the United States with the highest percentage of website traffic from female visitors in 2017
- Websites in the United States with the highest percentage of website traffic from male visitors in 2017
- Number of internet users in the United States from 2000 to 2016 (in millions)
- Number of internet users in the United States from 2017 to 2023 (in millions)
- Internet user penetration in the United States from 2017 to 2023
- Percentage of population using the internet in the United States from 2000 to 2017
- Number of unique visitors to leading mobile websites in the United States as of June 2017 (in millions)
- Number of unique visitors to leading desktop websites in the United States as of June 2017 (in millions)
- Share of adults in the United States who use the internet in 2018, by age group
- Share of adults in the United States who use the internet in 2018, by gender
- Share of adults in the United States who use the internet in 2018, by educational background
- Share of adults in the United States who use the internet in 2018, by annual household income
- Share of adults in the United States who use the internet in 2018, by ethnicity
- Share of adults in the United States who use the internet in 2018, by urbanity
- Adult internet usage penetration in the United States from 2000 to 2018, by age group
- Adult internet usage penetration in the United States from 2000 to 2018, by gender
- Internet usage frequency of adults in the United States as of January 2018
- Share of adults in the United States who are online almost constantly as of January 2018, by age group
- Share of adults in the United States who are online almost constantly as of January 2018, by gender
- Share of adults in the United States who are online almost constantly as of January 2018, by ethnicity
- Share of adults in the United States who are online almost constantly as of January 2018, by educational background
- Share of adults in the United States who are online almost constantly as of January 2018, by income
- Most popular multi-platform web properties in the United States in December 2018, based on number of unique visitors (in millions)
- Share of time spent on selected digital platforms in the United States as of June 2017, by age group
- Distribution of time spent on digital media properties in the United States as of June 2017, by access method
- Most popular daily online activities of adult internet users in the United States as of February 2017, by age group
- Most popular online video properties in the United States as of December 2018, ranked by unique viewers (in millions)
- Most concerning issues about online usage according to internet users in the United States as of May 2017
- Do you take measures to prevent the recording of your online behavior?
- Which of these measures do you take with regard to your online privacy?
- Most popular activities on smartphones and tablets according to device owners in the United States as of May 2017
- Mobile audience reach of leading smartphone apps in the United States as of December 2018
- Share of internet users in the United States with accounts on selected social media platforms as of February 2018, by age group
- Mobile share of social media visits in the United States from 4th quarter 2017 to 4th quarter 2018
- Percentage of U.S. population who currently use any social media from 2008 to 2018
- Reach of selected social networks in the United States as of February 2017
- Reach of selected social networks in the United States as of February 2017, by age group
- Leading social media websites in the United States in November 2016, based on share of visits
- Most popular mobile music and video apps in the United States as of October 2018, by monthly users (in millions)
- Most popular mobile social networking apps in the United States as of October 2018, by reach
- Most popular mobile messaging apps in the United States as of October 2018, by monthly active users (in millions)
- Most popular social networks of teenagers in the United States from fall 2012 to fall 2018
- Frequency of Facebook use in the United States as of February 2018
- Frequency of Twitter use in the United States as of January 2018
- Frequency of Instagram use in the United States as of January 2018
- Frequency of Snapchat use in the United States as of January 2018
- Retail e-commerce sales in the United States from 2017 to 2023 (in million U.S. dollars)
- Average value of online shopping orders in the United States from 2nd quarter 2012 to 4th quarter 2017 (in U.S. dollars)
- Number of mobile buyers in the United States from 2014 to 2020 (in millions)
- Mobile buyer penetration in the United States from 2014 to 2019
- Most popular retail websites in the United States as of December 2017, ranked by visitors (in millions)
- Primary reason that internet users in the United States make digital purchases as of March 2018
- Most popular mobile shopping apps in the United States as of October 2018, by reach
- Social media platform on which social media users in the United States last made a purchase directly from a social media post as of October 2017
- Percentage of adult U.S. internet users who get news online from 2000 to 2012, by gender
- U.S. adult internet users who got news online as recently as yesterday from 2000 to 2011
- U.S. adult internet users who get news online from 2000 to 2012, by ethnicity
- U.S. adult internet users who got news online as recently as yesterday from 2000 to 2011, by ethnicity
- Could you please tell me from this list the types of things you currently do at least weekly using the internet?*
- Share of internet users who regularly visit advice sites in the United Kingdom (UK) in 2012, by age
- Share of internet users who regularly visit gossip or celebrity news sites in the United Kingdom (UK) in 2012, by age
- Percentage of children in selected countries reporting their involvement in online activities between 2016 to 2017
- Countries with the highest internet penetration rate as of January 2019
- Number of broadband internet subscribers in the United States from 2011 to 2018, by cable provider (in 1,000s)
- Share of the offline population of the United States from 2000 to 2018
- Share of adults in the United States who do not use the internet as of January 2018, by age group
- Perspectives on the personal and societal impact of the internet in the United States as of January 2018
- Average daily time spent per capita with the internet in the United States from 2010 to 2018, by device (in minutes)
- Most popular daily online activities of adult internet users in the United States as of February 2017
- Most popular daily online activities of adult internet users in the United States as of February 2017, by gender
- Number of mobile phone internet users in the United States from 2017 to 2023 (in millions)
- Mobile phone internet user penetration in the United States from 2017 to 2023
- Leading iPhone apps in the Apple App Store in the United States in November 2018, by number of downloads (in millions)
- Leading Android apps in the Google Play Store in the United States as of November 2018, by number of downloads (in millions)
- Share of internet users in the United States who have used selected messenger apps to communicate with others as of August 2017
- Most popular mobile messaging apps in the United States as of October 2018, by mobile reach
- Most popular mobile messaging apps in the United States as of October 2018, by user engagement (in minutes per month)
- Most popular mobile messaging apps in the United States as of October 2018, by usage sessions
- Most popular mobile messaging apps in the United States as of October 2018, by average session duration (in minutes)
- Retail e-commerce sales including digital services in the United States from 2014 to 2022 (in billion U.S. dollars)
- Mobile retail e-commerce sales in the United States from 2013 to 2021 (in billion U.S. dollars)
- Number of digital buyers in the United States from 2013 to 2021 (in millions)
- Digital buyer penetration in the United States from 2013 to 2021
- Most popular mobile shopping apps in the United States as of October 2018, by monthly users (in millions)
- Frequency with which social media users in the United States make a purchase that begins on a social media platform as of August 2017
- Typical daily activities of adult internet users in the United States as of 2012
- Most popular online activities of internet users in Central America as of 2nd quarter 2013
- Most popular mobile phone activities of internet users in Central America as of 2nd quarter 2013
- Share of American internet users who visited CraigsList in the last month in 2018, by age
- According to you, which of the following players would be the best to counter hateful statements on the Internet?*
- Most common online activities in Norway in 2017
- Most popular online activities in Saudi Arabia in 2017
- Share of individuals accessing the internet in Italy in 2017, by frequency of use
- Which of these did you do online in relation to your recent purchase decision?
- Usage rate of online public services in Malaysia from October 2015 to January 2016, by purpose
- Level of concern about online activities being monitored in France as of March 2015*
- Penetration rate of selected online activities among Baby Boomer and Silent Generation fixed-line internet users in Mexico in 2016, by education
Statista offers dossiers and reports on over 170 industries. With Statista you are always able to make informed decisions and boost your work efficiency.
Internet & Telecommunications
- Social Media
- E-Commerce
- Online Video & Entertainment
- Advertising & Marketing
Consumer Goods & FMCG
- Alcoholic Beverages
- Cleaning Products
- Cosmetics & Personal Care
- Food & Nutrition
Retail & Trade
- Health & Hygiene
- International Trade
- Shopping Behavior
- Sports & Leisure
Travel, Tourism & Hospitality
- Business Travel
- Leisure Travel
- Accomodation
- Restaurants
Society
- Demographics
- Economy
- Education & Science
- Politics & Government
Transportation & Logistics
- Aviation
- Rail Transport
- Vehicles & Road Traffic
- Water Transport
You can only download this statistic as a Premium user.
As a Premium user you get access to the detailed source references and background information about this statistic.
As a Premium user you get access to background information and details about the release of this statistic.
As soon as this statistic is updated, you will immediately be notified via e-mail.
You need at least a Premium Account to use this feature.
This feature is limited to our corporate solutions.
Please contact us to get started with full access to dossiers, forecasts, studies and international data.

The Italian pharmaceutical market is among the fastest growing ones worldwide. This dossier provides data on the trends of the market, with special focus on pharmaceutical segments.

To our 150 Reports we added:
- Global Consumer Survey content
- Operational risk index by Fitch
- And more …

The global plastics industry is growing by approximately three percent every year. This dossier provides information about the global plastics industry in general as well as chapters on the major types of plastic, and recycling rates.

Updates on eCommerce, Digital Media, eTravel, eServices and more
- Market figures for 2018 to 2023
- Company and startup profiles
- User demographics

U.S. coal production has steadily declined in the past decade, but has been in the news in recent years due to President Trump's desire to revitalize the industry. This document provides an overview of the key figures, leading companies, and the employment trends in the U.S. coal mining industry.

This new export feature offers
- Structured graphical representation of the data
- Tailored target group analysis
- Option for further processing

The Polish e-commerce market is one of the fastest developing e-commerce markets in Europe. The latest data for Poland is presented in this dossier.

Plastic waste is an issue of global concern. Since China banned the import of recycled plastic, the U.S. has had to make adjustments to its management of plastic waste. This dossier provides an overview of plastic waste in the U.S.

This dossier provides an overview of hedge funds worldwide. Global hedge fund assets, performance, investors, and other topics are highlighted.

The Outdoor Advertising Association of America covers amongst others
- Number of billboards
- Outdoor advertising revenue
- Number of out-of-home displays

Find data, perceptions & more about
- Economic consequences
- Impact on the labor market
- A second referendum

Understand the recent developments in the Spanish eCommerce market!
- URL-related revenues
- Relevant online store KPIs
- eCommerce-related contacts

- Extended statistical dossier
- Insights, explanations & interpretations
- Challenges of the digital future

eCommerce is rapidly becoming a part of the Latin American shopping culture. The dossier includes data on
- Regional online shopping events
- Events by country

The outline of potential impacts of Brexit on UK industries has been updated in the UK Industry Reports.

Italian enterprises invest significantly in digital marketing. Find out about
- Relevant aspects & KPIs
- New trends
- Different strategies

Statista European Football Benchmark
- The big 5 European leagues
- All about the clubs & fans
- Sponsors & how they fit in
We use cookies to personalize contents and ads, offer social media features, and analyze access to our website. In your browser settings you can configure or disable this, respectively, and can delete any already placed cookies. For details, please see your browser’s Help section (by pressing F1). Please see our privacy statement for details about how we use data.