This statistic shows the number of imported rifles to the United States from 1986 to 2019. In 2019, around 648,703 rifles were imported to the U.S.
Number of imported rifles to the U.S. from 1986 to 2019
Loading statistic...
Basic Account
Get to know the platform
You only have access to basic statistics.
Starter Account
The ideal entry-level account for individual users
- Instant access to 1m statistics
- Download in XLS, PDF & PNG format
- Detailed references
$229 USD $199 USD / Month *
in the first 12 months
Professional Account
Full access
Business Solutions including all features.
* Prices do not include sales tax.
Other statistics that may interest you Statistics on
About the industry
10
- Basic Statistic Number of imported shotguns U.S. 1986-2019
- Basic Statistic U.S. number of imported firearms 1986-2020
- Basic Statistic U.S. number of imported firearms 2020, by firearm category
- Basic Statistic Number of imported handguns to the U.S. 1986-2019
- Basic Statistic U.S. number of imported rifles 2020, by country of origin
- Basic Statistic U.S. number of imported shotguns 2020, by country of origin
- Basic Statistic U.S. number of imported firearms 2020, by country of origin
- Basic Statistic Number of imported handguns into the U.S., by country 2019
- Basic Statistic U.S. number of exported rifles 1986-2021
- Basic Statistic U.S. number of rifles manufactured 1986-2021
About the region
10
- Basic Statistic U.S. number of shotguns manufactured 1986-2021
- Basic Statistic Number of exported pistols manufactured U.S. 1986-2018
- Basic Statistic Number of exported shotguns manufactured U.S. 1986-2018
- Basic Statistic U.S. number of firearms manufactured 1986-2021
- Basic Statistic U.S. number of firearms manufactured 2021, by firearm category
- Basic Statistic U.S. number of pistols manufactured 1986-2021
- Basic Statistic U.S. number of exported firearms 1986-2021
- Basic Statistic U.S. number of exported firearms manufactured 2021, by firearm category
- Basic Statistic Number of revolvers manufactured in the U.S. 1986-2018
- Basic Statistic U.S. number of firearms processed 1990-2020
Other regions
10
- Basic Statistic Arms exports from Sweden 2022, by country
- Basic Statistic Arms exports from Denmark 2021, by country
- Basic Statistic Arms imports to Australia 2020, by country
- Basic Statistic Share of Chinese arms exports 2012, by recipient
- Basic Statistic Arms exports from Norway 2021, by country
- Premium Statistic Top exporting countries of Emmentaler to Italy 2021, by volume
- Premium Statistic Brazil: monthly handgun import volume 2016-2019
- Premium Statistic Value of USA arms agreements MENA 1970-2017
- Premium Statistic Share of arms imports MENA 2000-2019, by supplier country
- Premium Statistic Import of wheat and flour into Algeria 2017-2022
Related statistics
10
- Basic Statistic U.S. number of federal firearms licensees 2020, by state
- Basic Statistic U.S. number of federal firearm dealers 1975-2020
- Basic Statistic U.S. arms imports 2022, by country
- Basic Statistic U.S. arms exports 2022, by country
- Basic Statistic U.S. arms exports 2022, by weapon category
- Basic Statistic U.S. arms imports 2022, by weapon category
- Basic Statistic U.S. arms exports 2000-2022
- Basic Statistic U.S. arms imports 2000-2022
- Basic Statistic U.S. public opinion on the strictness of laws covering firearms sale 1990-2022
- Basic Statistic U.S. public opinion on the jury’s verdict in the Zimmerman-Martin case 2013
Further related statistics
8
- Fair Trade certified vanilla, herbs and spices: U.S. imports 2007-2012
- Cobalt imports to the U.S. 2010-2022
- Construction exports worldwide 2020-2021, by country
- Total value of U.S. clothing imports 2011-2021
- Least peaceful U.S. metropolitan areas 2012
- U.S. export and import waterborne freight 2010
- U.S. Usage frequency of modern sporting rifles in the last 12 months 2010
- International merchandise trade of the United States 1990-2008
Further Content: You might find this interesting as well
Statistics
- Fair Trade certified vanilla, herbs and spices: U.S. imports 2007-2012
- Cobalt imports to the U.S. 2010-2022
- Construction exports worldwide 2020-2021, by country
- Total value of U.S. clothing imports 2011-2021
- Least peaceful U.S. metropolitan areas 2012
- U.S. export and import waterborne freight 2010
- U.S. Usage frequency of modern sporting rifles in the last 12 months 2010
- International merchandise trade of the United States 1990-2008
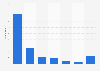
ATF, & US International Trade Commission. (October 16, 2020). Number of imported rifles to the U.S. from 1986 to 2019 [Graph]. In Statista. Retrieved October 01, 2023, from https://www.statista.com/statistics/215567/number-of-imported-rifles-to-the-us/
ATF, und US International Trade Commission. "Number of imported rifles to the U.S. from 1986 to 2019." Chart. October 16, 2020. Statista. Accessed October 01, 2023. https://www.statista.com/statistics/215567/number-of-imported-rifles-to-the-us/
ATF, US International Trade Commission. (2020). Number of imported rifles to the U.S. from 1986 to 2019. Statista. Statista Inc.. Accessed: October 01, 2023. https://www.statista.com/statistics/215567/number-of-imported-rifles-to-the-us/
ATF, and US International Trade Commission. "Number of Imported Rifles to The U.S. from 1986 to 2019." Statista, Statista Inc., 16 Oct 2020, https://www.statista.com/statistics/215567/number-of-imported-rifles-to-the-us/
ATF & US International Trade Commission, Number of imported rifles to the U.S. from 1986 to 2019 Statista, https://www.statista.com/statistics/215567/number-of-imported-rifles-to-the-us/ (last visited October 01, 2023)
Number of imported rifles to the U.S. from 1986 to 2019 [Graph], ATF, & US International Trade Commission, October 16, 2020. [Online]. Available: https://www.statista.com/statistics/215567/number-of-imported-rifles-to-the-us/