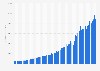
In 2022, Google removed 5.2 billion ads that were in violation of its various policies. The number has been steadily increasing int he five-year period presented in the data set.
Number of ads blocked by Google from 2016 to 2022 (in billions)
Loading statistic...
Basic Account
Get to know the platform
You only have access to basic statistics.
Starter Account
The ideal entry-level account for individual users
- Instant access to 1m statistics
- Download in XLS, PDF & PNG format
- Detailed references
$189 USD $149 USD / Month *
in the first 12 months
Professional Account
Full access
Business Solutions including all features.
* Prices do not include sales tax.
Other statistics that may interest you Google
Company financials
8
- Basic Statistic Alphabet: global annual revenue 2011-2022
- Basic Statistic Alphabet: quarterly revenue 2014-2023
- Basic Statistic Alphabet: quarterly net income 2014-2023
- Basic Statistic Alphabet: global annual revenue 2017-2022, by segment
- Basic Statistic Google: global annual revenue 2002-2022
- Basic Statistic Google: revenue distribution 2017-2022, by segment
- Basic Statistic Google: annual advertising revenue 2001-2022
- Basic Statistic Google sites: advertising revenue 2001-2022
Benchmark
7
- Basic Statistic Market value of the largest internet companies worldwide 2023
- Basic Statistic Market capitalization of the largest U.S. internet companies 2023
- Basic Statistic Apple, Google, and Microsoft: revenue comparison 2008-2022
- Basic Statistic Most valuable brands worldwide 2022
- Premium Statistic Biggest revenue source of leading tech companies 2023
- Basic Statistic Most visited multi-platform U.S. web properties 2023
- Premium Statistic Reach of most popular U.S. smartphone apps 2023
Search
7
- Basic Statistic Leading Google search queries worldwide Q2 2023
- Basic Statistic Global market share of leading desktop search engines 2015-2023
- Premium Statistic Google: desktop search market share in selected countries 2023
- Basic Statistic Google search engine global mobile market share 2015-2022
- Premium Statistic Leading U.S. search engines by share of core searches 2008-2023
- Premium Statistic Leading U.S. search engines by number of core searches 2008-2023
- Premium Statistic Leading theats to SEO worldwide 2021
YouTube
6
- Premium Statistic Global YouTube advertising revenues 2017-2022
- Basic Statistic YouTube: share of Google revenues 2017-2022
- Basic Statistic YouTube: global advertising revenues as of Q4 2023
- Basic Statistic Most viewed YouTube videos of all time 2023
- Basic Statistic YouTube: most viewed channels 2023
- Premium Statistic Most popular U.S. YouTube partner channels 2023, ranked by viewers
Google Play
7
- Premium Statistic Global Google Play and Apple App Store app revenues 2022
- Basic Statistic Global Google Play app downloads 2016-2022
- Basic Statistic Google Play: number of available apps 2009-2023
- Premium Statistic Average price of paid Android apps 2023
- Basic Statistic Leading Android gaming app publishers worldwide 2022, by revenue
- Premium Statistic Leading non-gaming Android app publishers worldwide 2022, by revenue
- Basic Statistic Google Play: quarterly growth of available apps as 2015-2022
Government
6
- Basic Statistic Government requests for content removal from Google H2 2022
- Basic Statistic Number of infringing URLs requested to be removed from Google Search 2022
- Premium Statistic Google user data requests by U.S. federal authorities 2010-2022
- Basic Statistic Google user data requests from federal agencies and governments H1 2022, by country
- Basic Statistic Google: quarterly federal lobbying expenses 2010-2022
- Basic Statistic EU Commission Google antitrust fines 2017-2022
Environmental impact
6
- Premium Statistic EPA Green Power Partnership's leading green power users in the U.S. 2022
- Premium Statistic EPA Green Power Partnership's Fortune 500 green power users in the U.S. 2022
- Premium Statistic Google: GHG emissions FY 2011-2020
- Premium Statistic Google: carbon intensity FY 2011-2020
- Basic Statistic Google: energy consumption FY 2011-2020
- Premium Statistic Google: waste generation FY 2015-2020
Further related statistics
16
- Search marketing tactic adoption in the U.S. 2016
- Google & Facebook advertising market share in Canada 2020
- Australia: share of search in mobile ad spend and mobile clicks 2013-2014
- Paid search spend growth of Google in Europe Q4 2014-Q4 2015
- Alphabet: ad spend in the U.S. 2012-2022
- Ad spending per internet user of search advertising in Russia 2017-2027
- U.S. Bing audience distribution 2018, by age
- Leading mobile search engines in Italy 2023, by market share
- Google: revenue distribution 2001-2018, by source
- Leading desktop search engines in the Netherlands 2023, by market share
- Google's share in general search advertising revenue Australia 2014-2018
- Phone and tablet share of paid search clicks in the U.S. 2021
- Google: brand value 2006-2023
- Reasons for content removal requests from government from Google India H2 2021
- Reasons for not using mobile ad blocks in Poland 2019
- Industry revenue of “manufacture of other plastic products“ in the Netherlands 2012-2025
Further Content: You might find this interesting as well
Statistics
- Search marketing tactic adoption in the U.S. 2016
- Google & Facebook advertising market share in Canada 2020
- Australia: share of search in mobile ad spend and mobile clicks 2013-2014
- Paid search spend growth of Google in Europe Q4 2014-Q4 2015
- Alphabet: ad spend in the U.S. 2012-2022
- Ad spending per internet user of search advertising in Russia 2017-2027
- U.S. Bing audience distribution 2018, by age
- Leading mobile search engines in Italy 2023, by market share
- Google: revenue distribution 2001-2018, by source
- Leading desktop search engines in the Netherlands 2023, by market share
- Google's share in general search advertising revenue Australia 2014-2018
- Phone and tablet share of paid search clicks in the U.S. 2021
- Google: brand value 2006-2023
- Reasons for content removal requests from government from Google India H2 2021
- Reasons for not using mobile ad blocks in Poland 2019
- Industry revenue of “manufacture of other plastic products“ in the Netherlands 2012-2025
Google. (March 29, 2023). Number of ads blocked by Google from 2016 to 2022 (in billions) [Graph]. In Statista. Retrieved September 22, 2023, from https://www.statista.com/statistics/665739/google-number-ads-blocked/
Google. "Number of ads blocked by Google from 2016 to 2022 (in billions)." Chart. March 29, 2023. Statista. Accessed September 22, 2023. https://www.statista.com/statistics/665739/google-number-ads-blocked/
Google. (2023). Number of ads blocked by Google from 2016 to 2022 (in billions). Statista. Statista Inc.. Accessed: September 22, 2023. https://www.statista.com/statistics/665739/google-number-ads-blocked/
Google. "Number of Ads Blocked by Google from 2016 to 2022 (in Billions)." Statista, Statista Inc., 29 Mar 2023, https://www.statista.com/statistics/665739/google-number-ads-blocked/
Google, Number of ads blocked by Google from 2016 to 2022 (in billions) Statista, https://www.statista.com/statistics/665739/google-number-ads-blocked/ (last visited September 22, 2023)
Number of ads blocked by Google from 2016 to 2022 (in billions) [Graph], Google, March 29, 2023. [Online]. Available: https://www.statista.com/statistics/665739/google-number-ads-blocked/