In 2023, Alphabet's revenue from Google websites (including YouTube advertising) amounted to around 206 billion U.S. dollars, up from 191 billion U.S. dollars in the previous year. Google Search is by far the biggest revenue segment of Alphabet. Alphabet Inc. is an American multinational conglomerate created in 2015 as the parent company of Google and several other companies previously owned by or tied to Google.
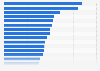
Annual revenue of Alphabet from 2017 to 2023, by segment
(in million U.S. dollars)
Alphabet Inc. is an American multinational conglomerate created in 2015 as the parent company of Google and several other companies previously owned by or tied to Google.
Other Bets – Other Bets – Other Bets is a combination of multiple operating segments that are not individually material. Other Bets includes businesses such as Access, Calico, CapitalG, GV, Verily, Waymo, and X. Revenues from the Other Bets are derived primarily through the sales of internet and TV services through Access as well as licensing and R&D services through Verily.
Google other revenues consist primarily of:
• Sales of apps and media content in the Google Play store;
• Sales of certain Google branded hardware, such as Chromecast;
• Service fees received for cloud and apps and our Maps API; and
• Licensing-related revenue.
• In Q1 2018, Nest joined Google’s hardware team. Consequently, the financial results of Nest are reported in the Google segment, with Nest revenues reflected in Google other revenues.
Profit from the additional features of your individual account
Currently, you are using a shared account. To use individual functions (e.g., mark statistics as favourites, set
statistic alerts) please log in with your personal account.
If you are an admin, please authenticate by logging in again.
Learn more about how Statista can support your business.
Alphabet. (January 31, 2024). Annual revenue of Alphabet from 2017 to 2023, by segment (in million U.S. dollars) [Graph]. In Statista. Retrieved October 31, 2024, from https://www.statista.com/statistics/633651/alphabet-annual-global-revenue-by-segment/
Alphabet. "Annual revenue of Alphabet from 2017 to 2023, by segment (in million U.S. dollars)." Chart. January 31, 2024. Statista. Accessed October 31, 2024. https://www.statista.com/statistics/633651/alphabet-annual-global-revenue-by-segment/
Alphabet. (2024). Annual revenue of Alphabet from 2017 to 2023, by segment (in million U.S. dollars). Statista. Statista Inc.. Accessed: October 31, 2024. https://www.statista.com/statistics/633651/alphabet-annual-global-revenue-by-segment/
Alphabet. "Annual Revenue of Alphabet from 2017 to 2023, by Segment (in Million U.S. Dollars)." Statista, Statista Inc., 31 Jan 2024, https://www.statista.com/statistics/633651/alphabet-annual-global-revenue-by-segment/
Alphabet, Annual revenue of Alphabet from 2017 to 2023, by segment (in million U.S. dollars) Statista, https://www.statista.com/statistics/633651/alphabet-annual-global-revenue-by-segment/ (last visited October 31, 2024)
Annual revenue of Alphabet from 2017 to 2023, by segment (in million U.S. dollars) [Graph], Alphabet, January 31, 2024. [Online]. Available: https://www.statista.com/statistics/633651/alphabet-annual-global-revenue-by-segment/