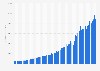
This statistic displays the greenhouse gas emissions of Google from the 2011 to 2018 financial years. Google emitted just above 15 million tons of carbon dioxide equivalents in 2018. Google reported that all of its emissions were neutralized by carbon offset projects.
Greenhouse gas emissions released by Google from FY 2011 to FY 2018 (in tons of carbon dioxide equivalent)*
Basic Account
Get to know the platform
You only have access to basic statistics.
This statistic is not included in your account.
Single Account
The ideal entry-level account for individual users
- Instant access to 1m statistics
- Download in XLS, PDF & PNG format
- Detailed references
$59 $39 / Month *
in the first 12 months
Corporate Account
Full access
Corporate solution including all features.
* Prices do not include sales tax.
Further Content: You might find this interesting as well
Statistics
- Google's carbon intensity 2011-2018
- Canada's fluctuation in air emissions by gas type 2017
- Global MillerCoors' greenhouse gas emissions by source 2015
- Waste Management's greenhouse gas emissions by source 2011-2014
- Gross greenhouse gas emissions New Zealand 2018, by sector
- Microsoft's greenhouse gas emissions by scope 2016
- Goldman Sachs' GHG emissions by scope 2016
- Canada's volatile organic compound emissions 1990-2018
- Canada's ammonia emissions 1990-2018
- Canada's nitrogen oxides emissions 2017, by province
- Canada's nitrogen oxides emissions 1990-2018
- Canada's black carbon emissions by source 2017
- Johnson & Johnson's facility GHG emissions by type 2010-2019
- Canada's nitrogen oxides emissions 2018, by source
- Greenhouse gases emitted by the residential sector in the United Kingdom 1990-2018
- Bolivia: population-weighted ozone pollution 2000-2017
- HC and NOx emission limits for vehicles in India 2017 by category
- Ecuador: PM air pollution concentration 2000-2017
- SF6 concentration level South Korea 2008-2018
- U.S. methane emissions 2015-2050
Google. (September 19, 2019). Greenhouse gas emissions released by Google from FY 2011 to FY 2018 (in tons of carbon dioxide equivalent)* [Graph]. In Statista. Retrieved January 22, 2021, from https://www.statista.com/statistics/788517/ghg-emissions-released-by-google/
Google. "Greenhouse gas emissions released by Google from FY 2011 to FY 2018 (in tons of carbon dioxide equivalent)*." Chart. September 19, 2019. Statista. Accessed January 22, 2021. https://www.statista.com/statistics/788517/ghg-emissions-released-by-google/
Google. (2019). Greenhouse gas emissions released by Google from FY 2011 to FY 2018 (in tons of carbon dioxide equivalent)*. Statista. Statista Inc.. Accessed: January 22, 2021. https://www.statista.com/statistics/788517/ghg-emissions-released-by-google/
Google. "Greenhouse Gas Emissions Released by Google from Fy 2011 to Fy 2018 (in Tons of Carbon Dioxide Equivalent)*." Statista, Statista Inc., 19 Sep 2019, https://www.statista.com/statistics/788517/ghg-emissions-released-by-google/
Google, Greenhouse gas emissions released by Google from FY 2011 to FY 2018 (in tons of carbon dioxide equivalent)* Statista, https://www.statista.com/statistics/788517/ghg-emissions-released-by-google/ (last visited January 22, 2021)