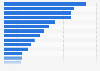
This statistic shows the number of professional developers in Europe in 2019, ranked by countries. Germany has the highest number of professional developers in Europe with over 901,4 thousand developers. The United Kingdom ranked second with 849,6 thousand professional developers.
Leading European countries with professional developers in Europe in 2019, ranked by countries
Basic Account
Get to know the platform
You only have access to basic statistics.
This statistic is not included in your account.
Starter Account
The ideal entry-level account for individual users
- Instant access to 1m statistics
- Download in XLS, PDF & PNG format
- Detailed references
$189 USD $149 USD / Month *
in the first 12 months
Professional Account
Full access
Business Solutions including all features.
* Prices do not include sales tax.
Other statistics that may interest you Statistics on
About the industry
10
- Premium Statistic Funding of AI companies in Israel 2018, by vertical
- Premium Statistic Funding of cybersecurity, defense & security companies in Israel 2018, by technology
- Premium Statistic Active high-tech companies in Israel 2014-2018, by business model
- Premium Statistic Acquisitions of high-tech companies in Israel 2018, by acquiring country
- Premium Statistic Physicians about blockchain technology readiness to enter healthcare worldwide 2018
- Premium Statistic U.S.: blockchain usage in mid-market 2017
- Premium Statistic State of big data/AI adoption among firms worldwide 2019-2023
- Premium Statistic Global tech job supply-demand balance 2020-2022, by country
- Basic Statistic Share of IT specialists in Russia in 2021, by age
- Premium Statistic Number of IT specialists in Russia in 2021, by position
About the region
10
- Basic Statistic Capital investment deals in European tech companies 2013-2019
- Basic Statistic Europe: value of funds raised in the tech ecosystem 2013-H1 2019, by fund size
- Premium Statistic Number of funds closed in the European tech ecosystem 2013-H1 2019, by fund size
- Premium Statistic Europe: horizon pooled net return of venture capital June 2019, by fund index
- Premium Statistic Europe: tech companies worth more than one billion dollars 2005-2019
- Premium Statistic Europe: tech companies by market cap 2019
- Premium Statistic Europe: value of VC-backed tech companies at IPO in M&As at exit 2019
- Premium Statistic Europe: behavior change due to focus on diversity and inclusion 2019, by gender
- Premium Statistic Europe: founder base salary and incentives 2019, by funding round stage
- Premium Statistic Europe: capital invested in tech companies 2013-2019, by country
Other regions
10
- Basic Statistic Annual cost base for Series A stage SaaS companies in Berlin 2019
- Basic Statistic Annual cost base for Series A stage SaaS companies in Paris 2019
- Basic Statistic Annual cost base for Series A stage SaaS companies in Madrid 2019
- Basic Statistic Annual cost base for Series A stage SaaS companies in Stockholm 2019
- Basic Statistic Annual cost base for Series A stage SaaS companies in Amsterdam 2019
- Basic Statistic Value of technology international trade value 2010-2020
- Premium Statistic Consumer needs from technology related to food and grocery United Kingdom 2016
- Premium Statistic Value of imports of high tech industry to Shenzhen 2011-2021
- Premium Statistic Number of PCT international patent applications in Shenzhen 2011-2021
- Premium Statistic Funding of healthcare companies in Israel 2018, by technology
Related statistics
10
- Basic Statistic Annual cost base for Series A stage SaaS companies in Barcelona 2019
- Premium Statistic User opinion: effects of technology on relationships in Spain 2014
- Premium Statistic Tech transformations most likely to be pursued by companies in next two years 2020
- Premium Statistic Challenges of technology transformations in companies 2020
- Premium Statistic Companies technology operating models, by top- and bottom-quartile performers 2020
- Premium Statistic Tech job postings worldwide 2017-2020, by country
- Premium Statistic Software developers by gender in Europe 2020, by country
- Premium Statistic Share of tech positions in Europe 2020, by gender
- Premium Statistic Technology industry worldwide: share of debt by type 2007-2020
- Premium Statistic Technology industry worldwide: return on employed capital 2007-2020
Further related statistics
1
Further Content: You might find this interesting as well
Atomico. (November 21, 2019). Leading European countries with professional developers in Europe in 2019, ranked by countries [Graph]. In Statista. Retrieved September 25, 2023, from https://www.statista.com/statistics/957876/professional-developers-in-europe/
Atomico. "Leading European countries with professional developers in Europe in 2019, ranked by countries." Chart. November 21, 2019. Statista. Accessed September 25, 2023. https://www.statista.com/statistics/957876/professional-developers-in-europe/
Atomico. (2019). Leading European countries with professional developers in Europe in 2019, ranked by countries. Statista. Statista Inc.. Accessed: September 25, 2023. https://www.statista.com/statistics/957876/professional-developers-in-europe/
Atomico. "Leading European Countries with Professional Developers in Europe in 2019, Ranked by Countries." Statista, Statista Inc., 21 Nov 2019, https://www.statista.com/statistics/957876/professional-developers-in-europe/
Atomico, Leading European countries with professional developers in Europe in 2019, ranked by countries Statista, https://www.statista.com/statistics/957876/professional-developers-in-europe/ (last visited September 25, 2023)
Leading European countries with professional developers in Europe in 2019, ranked by countries [Graph], Atomico, November 21, 2019. [Online]. Available: https://www.statista.com/statistics/957876/professional-developers-in-europe/