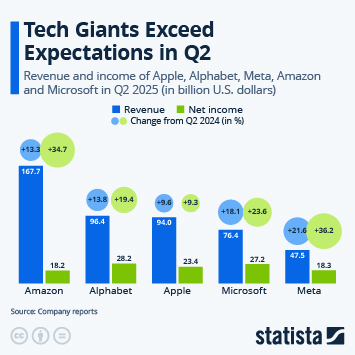
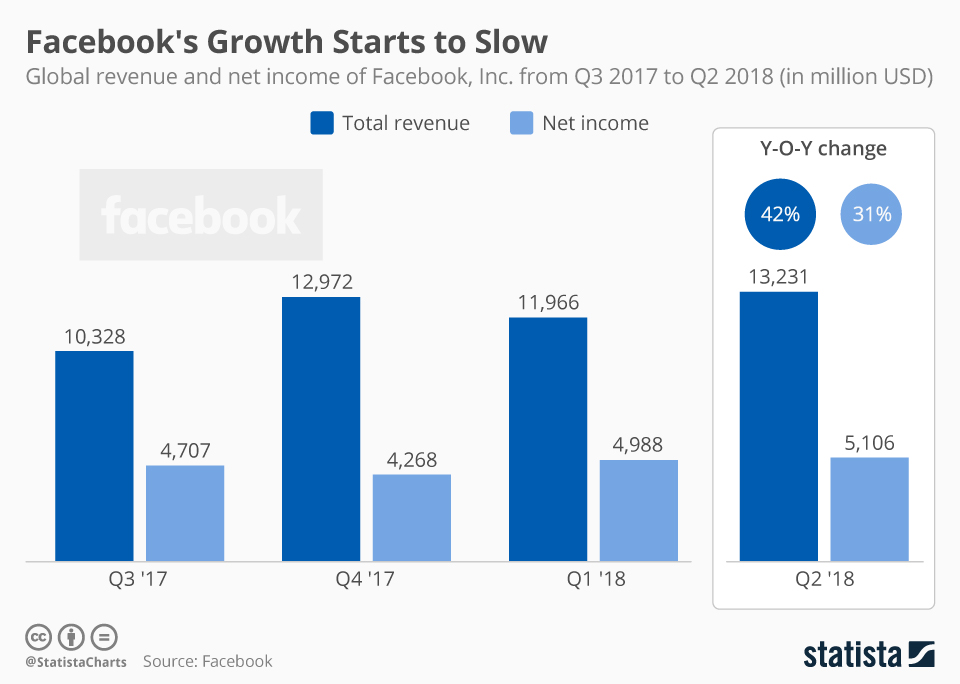
Facebook's share price tanked in reaction to the latest quarterly results of the social network giant. Despite continuing to expand, the slower than expected pace of user numbers and revenue per user is raising alarm bells for some investors. Revenue and net income also increased in Q2, but again, the figures came in below expectations and equated to disappointing year over year growth rates.
Q2 Results
Facebook's Growth Starts to Slow

Description
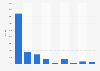
This chart shows the global revenue and net income of Facebook, Inc. from Q2 2017 to Q1 2018.