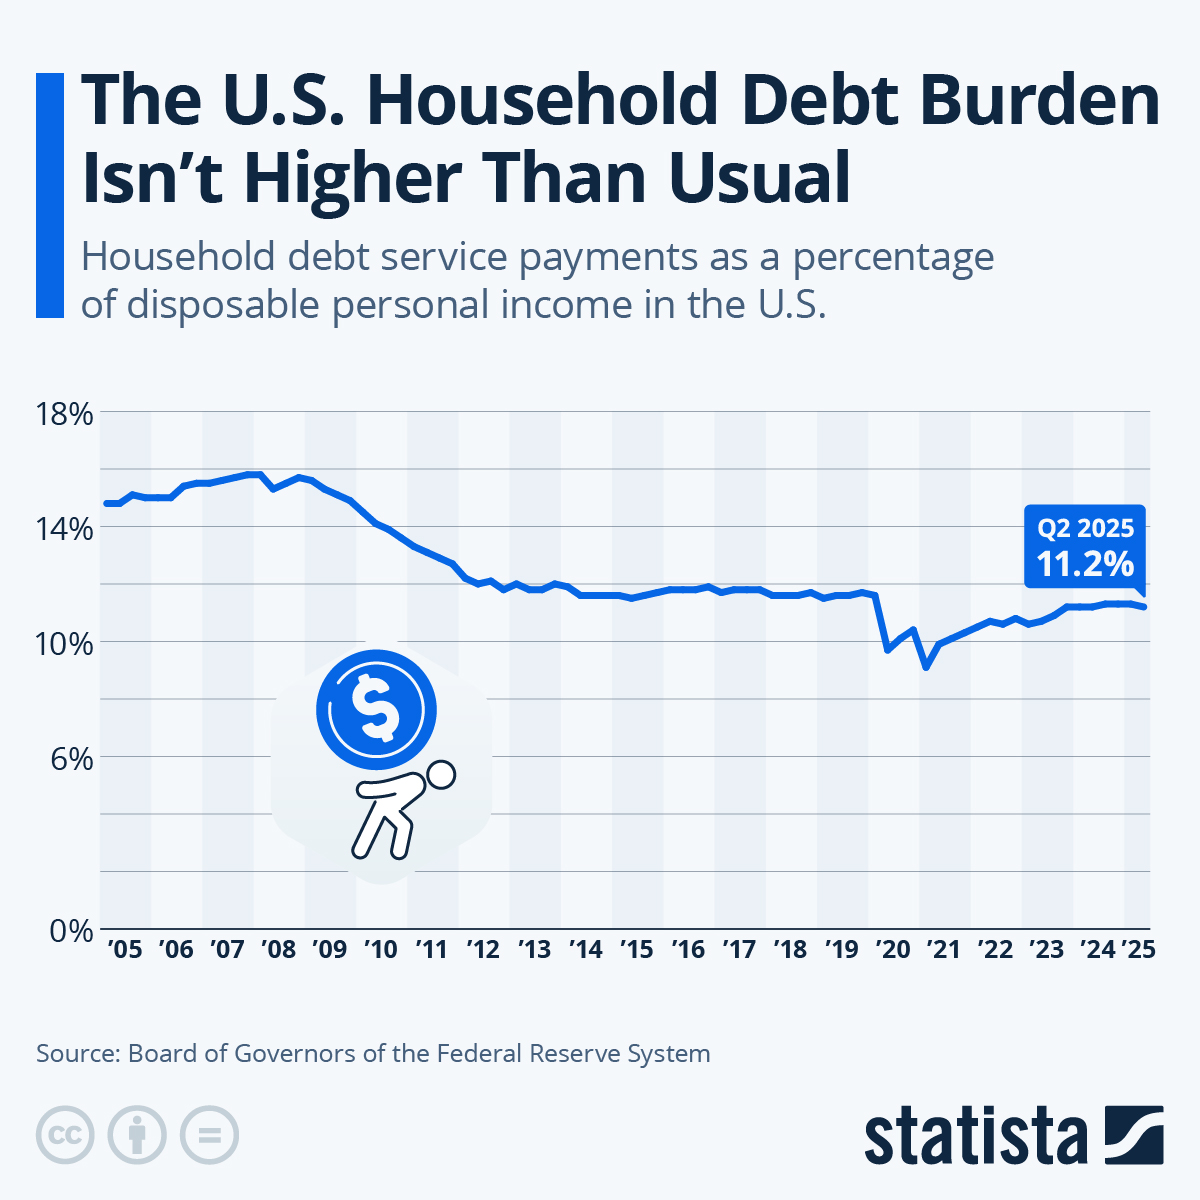
Even though household debt in the U.S. climbed to a record high of $18.6 trillion in Q3 2025 and many families are still reeling from high prices, Americans aren’t drowning in debt. In fact, the household debt burden, i.e. the average household’s debt service payments as a percentage of disposable income, isn’t particularly high from a historical point of view.
In Q2 2025, American households needed 11.2 percent of their disposable income to service their debts. That’s down from nearly 16 percent amid the financial crisis in 2008 and from an average of 12.1 percent between 2010 and 2019. And while the debt burden has climbed more or less steadily since 2021, that’s from historic lows during the Covid-19 pandemic, when many Americans used government stimulus payments to pay off debt and others temporarily lowered their payment obligations by taking advantage of loan forbearance programs.
Looking back further than 2005, the current rate of 11.2 percent is nothing out of the ordinary, either. Between 1980 and 2004, the household debt burden averaged 11.3 percent, and that’s using an old methodology that consistently delivered lower estimates than the methodology applied since 2005.