Adjust the presentation of the statistic and data points.
Share the statistic on social media channels or embed the statistic in your
website using "Embed Code", where available.
Cite this statistic and select one of the following formats: APA, Chicago, Harvard, MLA & Bluebook.
Print the statistic including description and metadata.
Chart type
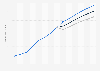
Distribution of e-commerce average greenhouse gas (GHG) emissions worldwide as of 2020, by source
Share this statistic
You have no right to use this feature.
Make sure to contact us if you are interested in scientific citation.
You can upgrade your account to enable this functionality for all statistics.
This feature is not available with your current account.Request access
* The study takes into consideration previous findings to elaborate assumptions about consumer behavior, the logistics ecosystem and the consumer transport.
Learn more about how Statista can support your business.
MIT Real Estate Innovation Lab. (January 12, 2021). Distribution of e-commerce average greenhouse gas (GHG) emissions worldwide as of 2020, by source [Graph]. In Statista. Retrieved September 24, 2025, from https://www.statista.com/statistics/1254302/e-commerce-average-emissions-by-source/
MIT Real Estate Innovation Lab. "Distribution of e-commerce average greenhouse gas (GHG) emissions worldwide as of 2020, by source." Chart. January 12, 2021. Statista. Accessed September 24, 2025. https://www.statista.com/statistics/1254302/e-commerce-average-emissions-by-source/
MIT Real Estate Innovation Lab. (2021). Distribution of e-commerce average greenhouse gas (GHG) emissions worldwide as of 2020, by source. Statista. Statista Inc.. Accessed: September 24, 2025. https://www.statista.com/statistics/1254302/e-commerce-average-emissions-by-source/
MIT Real Estate Innovation Lab. "Distribution of E-commerce Average Greenhouse Gas (Ghg) Emissions Worldwide as of 2020, by Source." Statista, Statista Inc., 12 Jan 2021, https://www.statista.com/statistics/1254302/e-commerce-average-emissions-by-source/
MIT Real Estate Innovation Lab, Distribution of e-commerce average greenhouse gas (GHG) emissions worldwide as of 2020, by source Statista, https://www.statista.com/statistics/1254302/e-commerce-average-emissions-by-source/ (last visited September 24, 2025)
Distribution of e-commerce average greenhouse gas (GHG) emissions worldwide as of 2020, by source [Graph], MIT Real Estate Innovation Lab, January 12, 2021. [Online]. Available: https://www.statista.com/statistics/1254302/e-commerce-average-emissions-by-source/
Advertisement
Profit from additional features with an Employee Account
Please create an employee account to be able to mark statistics as favorites.
Then you can access your favorite statistics via the star in the header.
Profit from the additional features of your individual account
Currently, you are using a shared account. To use individual functions (e.g., mark statistics as favourites, set
statistic alerts) please log in with your personal account.
If you are an admin, please authenticate by logging in again.