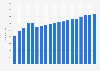
Share of FAST users in the U.S. 2021-2024

Log in or register to access precise data.

Share of consumers using at least one free ad-supported streaming TV (FAST) service in the United States from June 2021 to December 2024

CharacteristicShare of FAST users
- -
- -
- -
- -
- -
- -
- -
- -
Statistic: Share of consumers using at least one free ad-supported streaming TV (FAST) service in the United States from June 2021 to December 2024
Download
Show detailed source information?
Register for free
Already a member?
Log in
Sources

Use Ask Statista Research Service

Release date

February 2025

Region

United States

Survey time period

June 2021 to December 2024

Number of respondents

3,020 respondents

Supplementary notes

Original question: “Here are free streaming services that allow you to watch shows and movies that include ads. Which if any of these do you ever use?”

Number of respondents as follows: June 2021 (3,001); December 2023 (3,038); June 2022 (3,004); December 2022 (3,001); June 2023 (3,063); December 2023 (3,000); June 2024 (3,000); December 2024 (3,020).

Citation formats
Access all statistics starting from $2,388 USD yearly *

* For commercial use only

Basic Account

For single users
$0 USD
Always free
Access limited to Free Statistics. Premium Statistics are not included.
  • Free Statistics
Based on your interests

Starter Account

For single users
$199 USD
per month, billed annually 1
  • Free Statistics
  • Premium Statistics
  • The statistic on this page is a Premium Statistic and is included in this account.

Professional Account

For teams of up to 5 people
$1,299 USD
per month, billed annually 1
  • Free + Premium Statistics
  • Reports
  • Market Insights

1 All prices do not include sales tax. The account requires an annual contract and will renew after one year to the regular list price.

Leading companies trust Statista:
paypal google adobe pg samsung telekom

Related reports: Available to download in PDF or PPTX format

All datain one format
All data
in one format
Video streaming experience and preferences in the United States

Everything on "Video streaming experience and preferences in the United States" in one document: edited and divided into chapters, including detailed references.

Statista is a great source of knowledge, and pretty helpful to manage the daily work.
Christof Baron

Christof Baron
CEO, MindShare Germany

Statistics on " Video streaming experience and preferences in the United States "

Other statistics that may interest you Video streaming experience and preferences in the United States

Overview

5

Streaming features and reasons

5

Content discovery

7

Lean-back experience and binge-viewing

5

Popular devices and second-screen activities

6

Bundles and gamification

5

Live streaming

3

Socializing

6

Short-form content

4

Discover Statista

Need help with using Statista for your research? Tutorials and first steps
Do you have any questions about our business solutions?

We provide you with detailed information about our Professional Account.

Access all statistics starting from $2,388 USD yearly *

* For commercial use only

Basic Account

For single users
$0 USD
Always free
Access limited to Free Statistics. Premium Statistics are not included.
  • Free Statistics
Based on your interests

Starter Account

For single users
$199 USD
per month, billed annually 1
  • Free Statistics
  • Premium Statistics
  • The statistic on this page is a Premium Statistic and is included in this account.

Professional Account

For teams of up to 5 people
$1,299 USD
per month, billed annually 1
  • Free + Premium Statistics
  • Reports
  • Market Insights

1 All prices do not include sales tax. The account requires an annual contract and will renew after one year to the regular list price.

Learn more about how Statista can support your business.