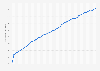
This statistic shows the average U.S. veterinary expenditure per animal in 2018. An average of 253 U.S. dollars worth of veterinary expenditures were paid for dogs in the United States.
Veterinary expenditure in the U.S. per animal in 2018 (in U.S. dollars)
Basic Account
Get to know the platform
You only have access to basic statistics.
This statistic is not included in your account.
Starter Account
The ideal entry-level account for individual users
- Instant access to 1m statistics
- Download in XLS, PDF & PNG format
- Detailed references
$199 USD / Month *
Professional Account
Full access
Business Solutions including all features.
* Prices do not include sales tax.
Other statistics that may interest you Statistics on
About the industry
10
- Premium Statistic Veterinary visits per household per year by animal 2012
- Basic Statistic Annual cost structure of a veterinarian household U.S. 2015
- Premium Statistic U.S. veterinary services revenue 2011-2021
- Premium Statistic U.S. veterinary services growth forecast 2006-2021
- Premium Statistic U.S. consumers spending on vet services 2008-2012
- Premium Statistic Number of veterinary institutions across Maharashtra India FY 2022, by type
- Premium Statistic Number of veterinary institutions across Mizoram India FY 2022, by type
- Premium Statistic Number of veterinary institutions across Tamil Nadu India FY 2022, by type
- Premium Statistic Number of veterinary institutions across Uttar Pradesh India FY 2022, by type
- Premium Statistic Number of veterinary institutions across Delhi India FY 2022, by type
About the region
10
- Basic Statistic Heska revenue 2015-2022
- Basic Statistic Heska point of care laboratory revenue 2017-2019, by product type
- Basic Statistic Heska core companion animal revenue 2017-2019, by subsegment
- Basic Statistic Price disparities for top product Advair Diskus U.S. vs international 2024
- Premium Statistic Price disparities for top product Januvia U.S. vs international 2024
- Basic Statistic Price disparities for Spiriva Handihaler - U.S. and international 2024
- Basic Statistic Price disparities for top product Symbicort - U.S. and international 2024
- Basic Statistic Price disparities for top product Viagra - U.S. and international 2024
- Basic Statistic Price disparities for top product Xarelto - U.S. and international 2024
- Basic Statistic Key measurements of U.S. CDER drug approvals in 2023
Other regions
10
- Premium Statistic Zoetis revenue distribution 2021-2023, by species
- Premium Statistic VECOL S.A.: net sales breakdown 2016-2018, by segment
- Premium Statistic Italy: market value distribution of veterinary drugs 2018, by type
- Premium Statistic North American veterinary services market size from 2014 to 2025
- Basic Statistic Reasons for pet abandonment in Spain in 2022
- Premium Statistic Distribution of the pharmaceutical market in China
- Premium Statistic Market value of pharmaceutical market in Vietnam 2012-2017
- Basic Statistic Leading European vaccine products by market share 2015-2022
- Premium Statistic Pharmaceutical revenue as percent of health expenditure by Asian country 2014
- Basic Statistic Pharmaceutical revenue as percent of health spending in African major countries 2014
Related statistics
10
- Basic Statistic Average cost of hospital per day by country 2015
- Basic Statistic France: number of manufacturers of basic pharmaceutical products 2011-2020
- Basic Statistic Turnover of veterinary activity enterprises in the UK 2008-2021
- Basic Statistic Ages of Alzheimer/dementia caregivers in the U.S. in 2023
- Basic Statistic Stress reported by Alzheimer and other dementia caregivers in the US 2014
- Basic Statistic Leading U.S. states by number of Alzheimer/dementia caregivers 2023
- Basic Statistic Leading U.S. states by unpaid care given by Alzheimer/dementia caregivers 2023
- Basic Statistic Leading U.S. states by value of unpaid care given by dementia caregivers 2023
- Basic Statistic Alzheimer and other dementia caregivers' unpaid care in the U.S. 2011-2023
- Premium Statistic Reasons for hospitalizations of US Alzheimer sufferers 2010
Further related statistics
10
- Merck & Co cash dividends declared 2006-2023
- Merck & Co total assets 2009-2023
- Sanofi's total assets 2007-2023
- Merck & Co - expenditure on research and development 2006-2023
- Pfizer's revenues in the U.S. and abroad 2009-2023
- AstraZeneca's revenue from top product Pulmicort 2006-2023
- AstraZeneca's expenditure on research and development 2006-2023
- Sales of Johnson & Johnson worldwide 2011-2023, by segment
- Johnson & Johnson's number of employees 2004-2023
- Walgreens gross profit and net earnings in the U.S. 2005-2023
Further Content: You might find this interesting as well
Statistics
- Merck & Co cash dividends declared 2006-2023
- Merck & Co total assets 2009-2023
- Sanofi's total assets 2007-2023
- Merck & Co - expenditure on research and development 2006-2023
- Pfizer's revenues in the U.S. and abroad 2009-2023
- AstraZeneca's revenue from top product Pulmicort 2006-2023
- AstraZeneca's expenditure on research and development 2006-2023
- Sales of Johnson & Johnson worldwide 2011-2023, by segment
- Johnson & Johnson's number of employees 2004-2023
- Walgreens gross profit and net earnings in the U.S. 2005-2023
AVMA. (November 19, 2018). Veterinary expenditure in the U.S. per animal in 2018 (in U.S. dollars) [Graph]. In Statista. Retrieved March 29, 2024, from https://www.statista.com/statistics/196558/veterinary-expenditure-per-animal-in-the-us-2010/
AVMA. "Veterinary expenditure in the U.S. per animal in 2018 (in U.S. dollars)." Chart. November 19, 2018. Statista. Accessed March 29, 2024. https://www.statista.com/statistics/196558/veterinary-expenditure-per-animal-in-the-us-2010/
AVMA. (2018). Veterinary expenditure in the U.S. per animal in 2018 (in U.S. dollars). Statista. Statista Inc.. Accessed: March 29, 2024. https://www.statista.com/statistics/196558/veterinary-expenditure-per-animal-in-the-us-2010/
AVMA. "Veterinary Expenditure in The U.S. per Animal in 2018 (in U.S. Dollars)." Statista, Statista Inc., 19 Nov 2018, https://www.statista.com/statistics/196558/veterinary-expenditure-per-animal-in-the-us-2010/
AVMA, Veterinary expenditure in the U.S. per animal in 2018 (in U.S. dollars) Statista, https://www.statista.com/statistics/196558/veterinary-expenditure-per-animal-in-the-us-2010/ (last visited March 29, 2024)
Veterinary expenditure in the U.S. per animal in 2018 (in U.S. dollars) [Graph], AVMA, November 19, 2018. [Online]. Available: https://www.statista.com/statistics/196558/veterinary-expenditure-per-animal-in-the-us-2010/