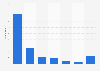
The District of Columbia had the highest robbery rate in the United States in 2022, with 357.5 robberies per 100,000 inhabitants. The lowest robbery rate in the country was found in Wyoming, with 7.9 robberies per 100,000 inhabitants.
Crime in the District of Columbia
The violent crime rate in the District of Columbia was found to be the highest in the United States, with there being a few reasons for this: Firstly, the population of the District of Columbia is quite low (causing a higher rate of crime), and secondly, issues such as the crack epidemic of the 1990s exacerbated the prevalence of crime in the District. As rising rents and gentrification force more people out of the District, crime is moving into neighboring Maryland and Virginia suburbs, as poorer residents seek more affordable living conditions.
Crime in the United States
Overall, violent crime in the United States and the District of Columbia today is far below the violent crime rate of the 1990s. While some may feel that crime is on the rise, due in part to media sensationalism, in fact the opposite is true, and the United States are becoming safer over time.
Robbery rate in the United States in 2022, by state
(per 100,000 inhabitants)
*Limited data were available for Florida, Illinois, Maryland, and Pennsylvania.
Robbery rate is based on the population covered by the agencies from whom the FBI collected the data from.
Due to the FBI's transition to a new crime reporting system, only 15,726 of 18,888 participating law enforcement agencies submitted crime data to the FBI for 2022. As a result, figures may not accurately reflect the total number of crimes.
Profit from the additional features of your individual account
Currently, you are using a shared account. To use individual functions (e.g., mark statistics as favourites, set
statistic alerts) please log in with your personal account.
If you are an admin, please authenticate by logging in again.
Learn more about how Statista can support your business.
FBI. (October 16, 2023). Robbery rate in the United States in 2022, by state (per 100,000 inhabitants) [Graph]. In Statista. Retrieved October 26, 2024, from https://www.statista.com/statistics/232564/robbery-rate-in-the-us-by-state/
FBI. "Robbery rate in the United States in 2022, by state (per 100,000 inhabitants)." Chart. October 16, 2023. Statista. Accessed October 26, 2024. https://www.statista.com/statistics/232564/robbery-rate-in-the-us-by-state/
FBI. (2023). Robbery rate in the United States in 2022, by state (per 100,000 inhabitants). Statista. Statista Inc.. Accessed: October 26, 2024. https://www.statista.com/statistics/232564/robbery-rate-in-the-us-by-state/
FBI. "Robbery Rate in The United States in 2022, by State (per 100,000 Inhabitants)." Statista, Statista Inc., 16 Oct 2023, https://www.statista.com/statistics/232564/robbery-rate-in-the-us-by-state/
FBI, Robbery rate in the United States in 2022, by state (per 100,000 inhabitants) Statista, https://www.statista.com/statistics/232564/robbery-rate-in-the-us-by-state/ (last visited October 26, 2024)
Robbery rate in the United States in 2022, by state (per 100,000 inhabitants) [Graph], FBI, October 16, 2023. [Online]. Available: https://www.statista.com/statistics/232564/robbery-rate-in-the-us-by-state/