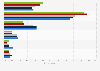
In 2024, men in the United States spent approximately 42.6 minutes per day on games and using a computer for leisure. General video gaming use among the U.S. population increased significantly during the COVID-19 pandemic. Between May and December 2020, U.S. men spent an average 49.2 daily minutes on playing games and using computers for leisure, up from 36 minutes per day in the corresponding period of 2019. Women spent an average 25.8 minutes per day on gaming and leisure computer use.
Advertisement
Advertisement
Average daily time spent playing games and using computer for leisure per capita in the United States from 2019 to 2024, by gender
(in minutes)
Characteristic
Men
Women
2019*
36
18.6
2020*
49.2
26.4
2021
41.4
25.8
2022
43.12
25.48
2023
42
25.48
2024
42.6
25.8
0102030405060
Add this content to your personal favorites. These can be accessed from the favorites menu in the main navigation.
You have no right to use this feature.
Make sure to contact us if you are interested in scientific citation.
You can upgrade your account to enable this functionality for all statistics.
This feature is not available with your current account.Request access
Statista has been my savior on several occasions.
The site is easy to maneuver and the data is in a format that can
go right into a report or presentation.
Learn more about how Statista can support your business.
Bureau of Labor Statistics. (July 3, 2025). Average daily time spent playing games and using computer for leisure per capita in the United States from 2019 to 2024, by gender (in minutes) [Graph]. In Statista. Retrieved August 14, 2025, from https://www.statista.com/statistics/502144/average-daily-time-playing-games-and-using-computer-us-by-gender/
Bureau of Labor Statistics. "Average daily time spent playing games and using computer for leisure per capita in the United States from 2019 to 2024, by gender (in minutes)." Chart. July 3, 2025. Statista. Accessed August 14, 2025. https://www.statista.com/statistics/502144/average-daily-time-playing-games-and-using-computer-us-by-gender/
Bureau of Labor Statistics. (2025). Average daily time spent playing games and using computer for leisure per capita in the United States from 2019 to 2024, by gender (in minutes). Statista. Statista Inc.. Accessed: August 14, 2025. https://www.statista.com/statistics/502144/average-daily-time-playing-games-and-using-computer-us-by-gender/
Bureau of Labor Statistics. "Average Daily Time Spent Playing Games and Using Computer for Leisure per Capita in The United States from 2019 to 2024, by Gender (in Minutes)." Statista, Statista Inc., 3 Jul 2025, https://www.statista.com/statistics/502144/average-daily-time-playing-games-and-using-computer-us-by-gender/
Bureau of Labor Statistics, Average daily time spent playing games and using computer for leisure per capita in the United States from 2019 to 2024, by gender (in minutes) Statista, https://www.statista.com/statistics/502144/average-daily-time-playing-games-and-using-computer-us-by-gender/ (last visited August 14, 2025)
Average daily time spent playing games and using computer for leisure per capita in the United States from 2019 to 2024, by gender (in minutes) [Graph], Bureau of Labor Statistics, July 3, 2025. [Online]. Available: https://www.statista.com/statistics/502144/average-daily-time-playing-games-and-using-computer-us-by-gender/
Advertisement
Profit from additional features with an Employee Account
Please create an employee account to be able to mark statistics as favorites.
Then you can access your favorite statistics via the star in the header.
Profit from the additional features of your individual account
Currently, you are using a shared account. To use individual functions (e.g., mark statistics as favourites, set
statistic alerts) please log in with your personal account.
If you are an admin, please authenticate by logging in again.