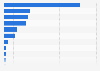
In the fiscal year 2023, the watch manufacturer had an EBIT accounting for about 4.13 billion Indian rupees, significantly increase from about 1.34 billion rupees in the previous fiscal year. An overall increase in the EBIT was seen from 2015 until 2020.
EBIT of Titan Company Limited's watch segment from financial year 2015 to 2023 (in billion Indian rupees)
Basic Account
Get to know the platform
You only have access to basic statistics.
This statistic is not included in your account.
Starter Account
The ideal entry-level account for individual users
- Instant access to 1m statistics
- Download in XLS, PDF & PNG format
- Detailed references
$149 USD / Month *
Professional Account
Full access
Business Solutions including all features.
* Prices do not include sales tax.
Other statistics that may interest you Statistics on
About the industry
10
- Basic Statistic Net sales of the Fossil Group worldwide from 2015 to 2022, by product category
- Basic Statistic Sales share of the Fossil Group worldwide in 2022, by product category
- Basic Statistic Leading exporters of watches and clocks worldwide 2021
- Basic Statistic Leading importers of watches and clocks worldwide 2021
- Premium Statistic Titan Company's income from watches FY 2015-2023
- Basic Statistic Net sales of the Fossil Group in the United States from 2015 to 2022
- Basic Statistic Sales share of the Fossil Group worldwide in 2022, by brand
- Basic Statistic Number of stores of the Fossil Group worldwide from 2016 to 2022, by region
- Basic Statistic Sales share of the Fossil Group worldwide in 2022, by region
- Basic Statistic Number of employees of the Fossil Group worldwide from 2016 to 2022
About the region
10
- Premium Statistic Titan Company's quarterly net sales of watch segment Q1 FY 2017-Q1 FY 2024
- Premium Statistic Titan Company's watch segment EBIT margin Q1 FY 2017-Q1 FY 2024
- Premium Statistic Watch industry export and import in India FY 2016-2022
- Premium Statistic Titan Company's watch segment EBIT Q1 FY 2017-Q1 FY 2024
- Premium Statistic Titan Company's profit before tax FY 2015-2023
- Premium Statistic Titan Company watches volume change FY 2017-2022
- Premium Statistic Frequency of using smart wearables India 2022, by gender
- Premium Statistic Common activities on smartwatches India 2022, by age group
- Premium Statistic Apps connected to smart wearables India 2022
- Premium Statistic Apps connected to smart wearables India 2022, by gender
Other regions
9
- Basic Statistic Net sales of the Fossil Group worldwide from 2013 to 2022
- Basic Statistic Number of stores of the Fossil Group in the U.S. as of 2019, by store type
- Premium Statistic Leading 'Watches' brands in FR 2021, by number of users
- Premium Statistic Most popular watch types in the future among watch traders in Hong Kong 2018
- Basic Statistic Sales of the largest watch companies worldwide 2012
- Premium Statistic Revenue of the watches & jewelry industry in Poland 2013-2026
- Premium Statistic Clock & watch market size South Korea 2012-2021
- Premium Statistic Leading wristwatch brands in Great Britain 2020, by number of users
- Premium Statistic Watch industry: market value in France 2010-2020
Related statistics
10
- Premium Statistic Consumer demand of gold jewelry in India 2007-2022
- Premium Statistic Kalyan Jewellers profit after tax FY 2016-2023
- Premium Statistic Kalyan Jewellers operating income FY 2016-2023
- Premium Statistic Titan Company's jewelry segment EBIT Q1 FY 2017-Q1 FY 2024
- Premium Statistic Titan Company's quarterly net sales Q1 FY 2017- Q4 FY 2023
- Premium Statistic Titan Company's quarterly PBT Q1 FY 2017-Q4 FY 2023
- Premium Statistic Titan Company's quarterly PBT margin Q1 FY 2017-Q4 FY 2023
- Premium Statistic Tribhovandas Bhimji Zaveri's revenue FY 2012-2022
- Premium Statistic PC Jeweller's domestic revenue FY 2012-2023
- Premium Statistic PC Jeweller's net sales FY 2012-2023
Further related statistics
5
Further Content: You might find this interesting as well
Statistics
Titan Company. (July 6, 2023). EBIT of Titan Company Limited's watch segment from financial year 2015 to 2023 (in billion Indian rupees) [Graph]. In Statista. Retrieved December 02, 2023, from https://www.statista.com/statistics/1008536/india-titan-watches-ebit/
Titan Company. "EBIT of Titan Company Limited's watch segment from financial year 2015 to 2023 (in billion Indian rupees)." Chart. July 6, 2023. Statista. Accessed December 02, 2023. https://www.statista.com/statistics/1008536/india-titan-watches-ebit/
Titan Company. (2023). EBIT of Titan Company Limited's watch segment from financial year 2015 to 2023 (in billion Indian rupees). Statista. Statista Inc.. Accessed: December 02, 2023. https://www.statista.com/statistics/1008536/india-titan-watches-ebit/
Titan Company. "Ebit of Titan Company Limited's Watch Segment from Financial Year 2015 to 2023 (in Billion Indian Rupees)." Statista, Statista Inc., 6 Jul 2023, https://www.statista.com/statistics/1008536/india-titan-watches-ebit/
Titan Company, EBIT of Titan Company Limited's watch segment from financial year 2015 to 2023 (in billion Indian rupees) Statista, https://www.statista.com/statistics/1008536/india-titan-watches-ebit/ (last visited December 02, 2023)
EBIT of Titan Company Limited's watch segment from financial year 2015 to 2023 (in billion Indian rupees) [Graph], Titan Company, July 6, 2023. [Online]. Available: https://www.statista.com/statistics/1008536/india-titan-watches-ebit/