Earlier today, Epic Games launched the sixth season of Fortnite, adding a number of new features to the tremendously popular online multiplayer game. Titled “Darkness Rises”, the update adds new locations, pets and a bunch of Halloween-themed content to the game played by 125+ million people across the globe.
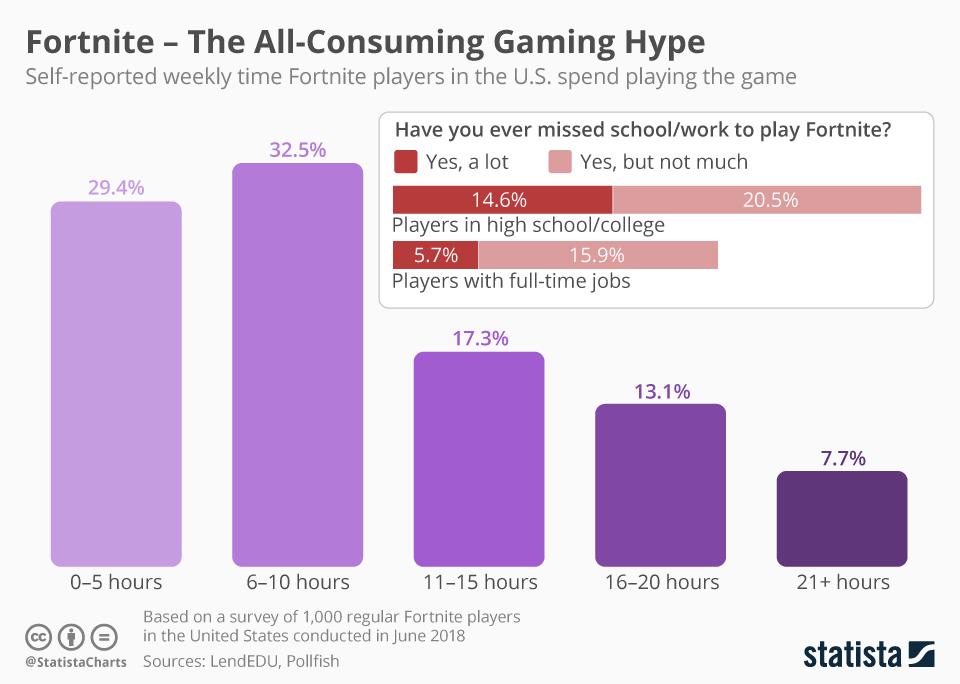
After its launch in 2017, Fortnite quickly became a global phenomenon, attracting millions of players and earning hundreds of millions in in-game revenue each month. As the following chart, based on a survey conducted by LendEDU, shows, Fortnight players tend to spend a lot of time with the game. In many cases it even interferes with real life duties, as 35 and 21 percent of players admit to having skipped school or work, respectively, to play Fortnite instead.
Fortnite – The All-Consuming Gaming Hype
Fortnite

Description
This chart shows how much time American Fortnite players spend playing the game per week.


